Hopi vs Spanish American Indian Median Male Earnings
COMPARE
Hopi
Spanish American Indian
Median Male Earnings
Median Male Earnings Comparison
Hopi
Spanish American Indians
$42,060
MEDIAN MALE EARNINGS
0.0/ 100
METRIC RATING
341st/ 347
METRIC RANK
$44,010
MEDIAN MALE EARNINGS
0.0/ 100
METRIC RATING
335th/ 347
METRIC RANK
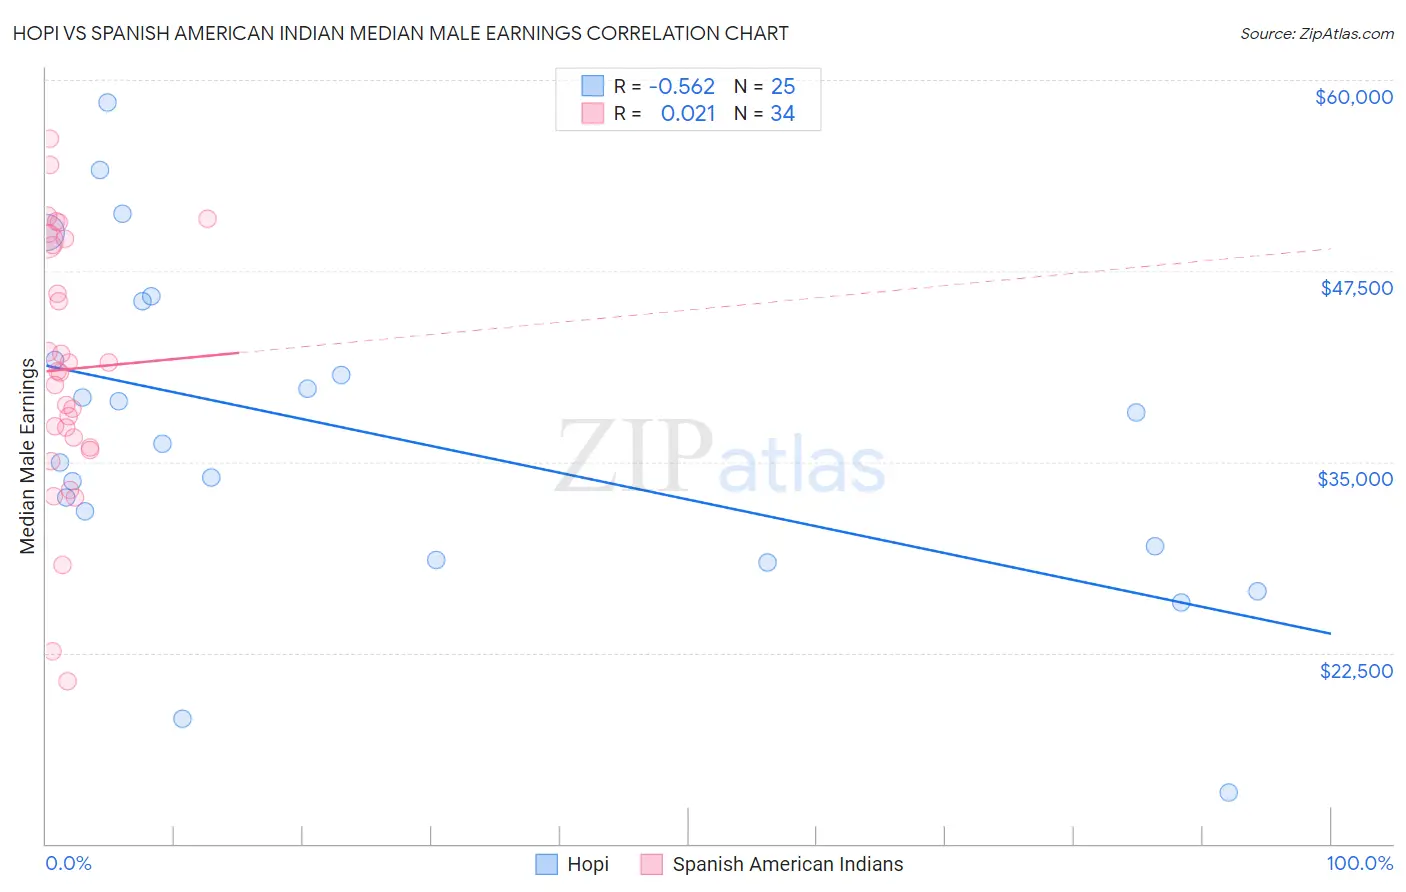
Hopi vs Spanish American Indian Median Male Earnings Correlation Chart
The statistical analysis conducted on geographies consisting of 74,728,825 people shows a substantial negative correlation between the proportion of Hopi and median male earnings in the United States with a correlation coefficient (R) of -0.562 and weighted average of $42,060. Similarly, the statistical analysis conducted on geographies consisting of 73,148,083 people shows no correlation between the proportion of Spanish American Indians and median male earnings in the United States with a correlation coefficient (R) of 0.021 and weighted average of $44,010, a difference of 4.6%.
Median Male Earnings Correlation Summary
| Measurement | Hopi | Spanish American Indian |
| Minimum | $13,333 | $20,599 |
| Maximum | $58,516 | $56,169 |
| Range | $45,183 | $35,570 |
| Mean | $36,698 | $41,061 |
| Median | $36,172 | $40,899 |
| Interquartile 25% (IQ1) | $29,042 | $35,978 |
| Interquartile 75% (IQ3) | $43,616 | $49,409 |
| Interquartile Range (IQR) | $14,573 | $13,431 |
| Standard Deviation (Sample) | $10,705 | $8,549 |
| Standard Deviation (Population) | $10,489 | $8,423 |
Demographics Similar to Hopi and Spanish American Indians by Median Male Earnings
In terms of median male earnings, the demographic groups most similar to Hopi are Navajo ($42,098, a difference of 0.090%), Pima ($42,357, a difference of 0.71%), Arapaho ($41,758, a difference of 0.72%), Lumbee ($41,715, a difference of 0.83%), and Crow ($42,434, a difference of 0.89%). Similarly, the demographic groups most similar to Spanish American Indians are Immigrants from Yemen ($44,083, a difference of 0.17%), Immigrants from Congo ($44,204, a difference of 0.44%), Immigrants from Cuba ($43,461, a difference of 1.3%), Bahamian ($44,756, a difference of 1.7%), and Native/Alaskan ($44,775, a difference of 1.7%).
| Demographics | Rating | Rank | Median Male Earnings |
| Kiowa | 0.0 /100 | #328 | Tragic $45,094 |
| Yakama | 0.0 /100 | #329 | Tragic $45,002 |
| Immigrants | Mexico | 0.0 /100 | #330 | Tragic $44,960 |
| Natives/Alaskans | 0.0 /100 | #331 | Tragic $44,775 |
| Bahamians | 0.0 /100 | #332 | Tragic $44,756 |
| Immigrants | Congo | 0.0 /100 | #333 | Tragic $44,204 |
| Immigrants | Yemen | 0.0 /100 | #334 | Tragic $44,083 |
| Spanish American Indians | 0.0 /100 | #335 | Tragic $44,010 |
| Immigrants | Cuba | 0.0 /100 | #336 | Tragic $43,461 |
| Menominee | 0.0 /100 | #337 | Tragic $42,581 |
| Crow | 0.0 /100 | #338 | Tragic $42,434 |
| Pima | 0.0 /100 | #339 | Tragic $42,357 |
| Navajo | 0.0 /100 | #340 | Tragic $42,098 |
| Hopi | 0.0 /100 | #341 | Tragic $42,060 |
| Arapaho | 0.0 /100 | #342 | Tragic $41,758 |
| Lumbee | 0.0 /100 | #343 | Tragic $41,715 |
| Pueblo | 0.0 /100 | #344 | Tragic $41,314 |
| Puerto Ricans | 0.0 /100 | #345 | Tragic $40,071 |
| Tohono O'odham | 0.0 /100 | #346 | Tragic $39,543 |
| Yup'ik | 0.0 /100 | #347 | Tragic $39,504 |