Immigrants from Uzbekistan vs Immigrants from Oceania Householder Income Ages 25 - 44 years
COMPARE
Immigrants from Uzbekistan
Immigrants from Oceania
Householder Income Ages 25 - 44 years
Householder Income Ages 25 - 44 years Comparison
Immigrants from Uzbekistan
Immigrants from Oceania
$98,849
HOUSEHOLDER INCOME AGES 25 - 44 YEARS
91.5/ 100
METRIC RATING
122nd/ 347
METRIC RANK
$97,623
HOUSEHOLDER INCOME AGES 25 - 44 YEARS
84.5/ 100
METRIC RATING
135th/ 347
METRIC RANK
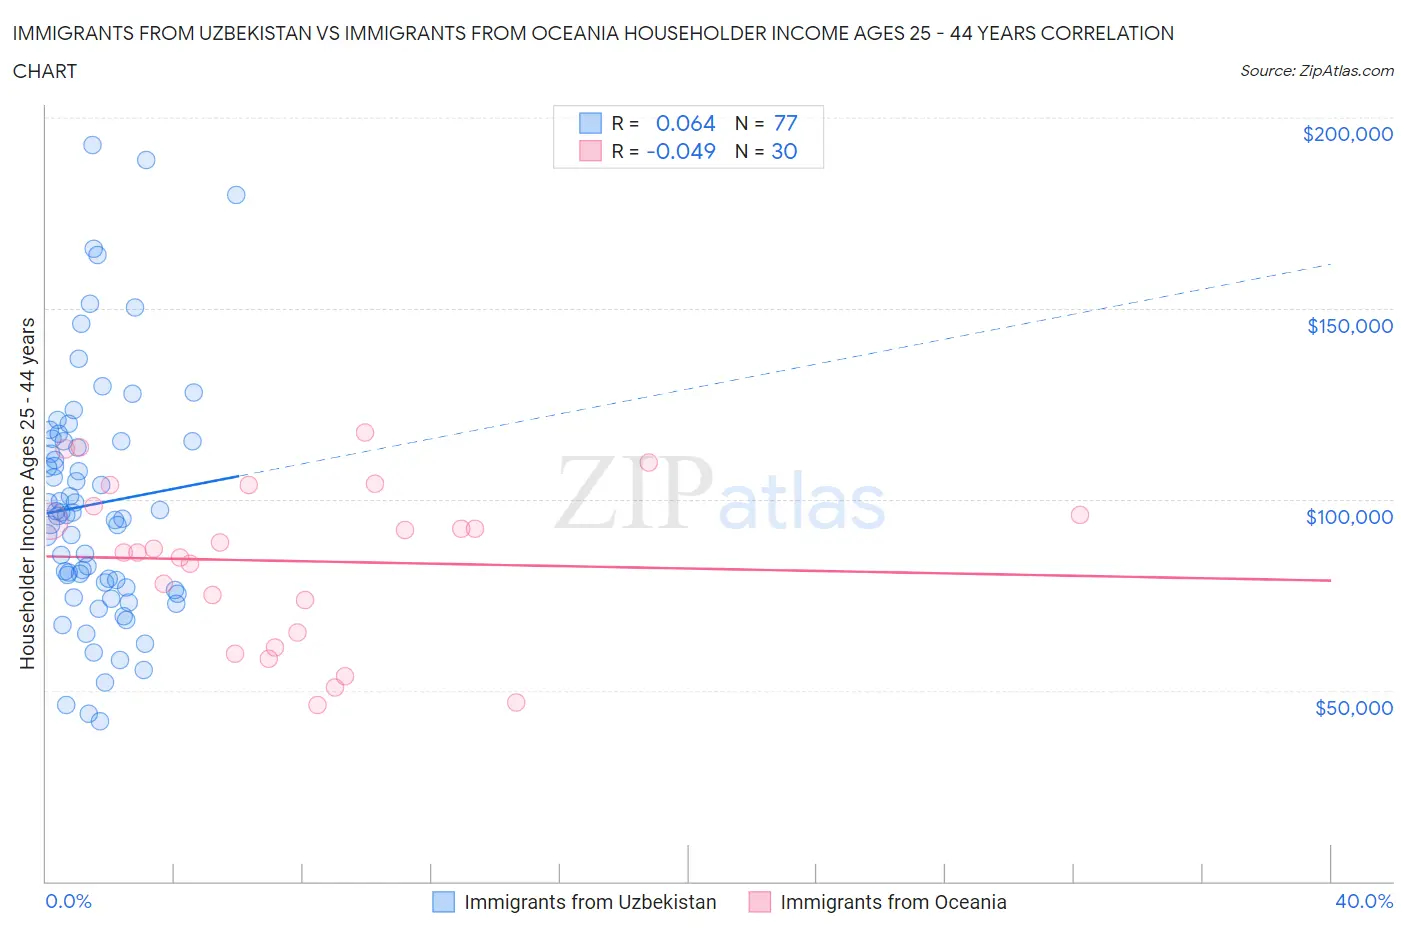
Immigrants from Uzbekistan vs Immigrants from Oceania Householder Income Ages 25 - 44 years Correlation Chart
The statistical analysis conducted on geographies consisting of 118,660,152 people shows a slight positive correlation between the proportion of Immigrants from Uzbekistan and household income with householder between the ages 25 and 44 in the United States with a correlation coefficient (R) of 0.064 and weighted average of $98,849. Similarly, the statistical analysis conducted on geographies consisting of 305,010,299 people shows no correlation between the proportion of Immigrants from Oceania and household income with householder between the ages 25 and 44 in the United States with a correlation coefficient (R) of -0.049 and weighted average of $97,623, a difference of 1.3%.
Householder Income Ages 25 - 44 years Correlation Summary
| Measurement | Immigrants from Uzbekistan | Immigrants from Oceania |
| Minimum | $41,890 | $46,211 |
| Maximum | $192,849 | $117,593 |
| Range | $150,959 | $71,381 |
| Mean | $98,791 | $83,848 |
| Median | $95,849 | $86,701 |
| Interquartile 25% (IQ1) | $76,528 | $65,112 |
| Interquartile 75% (IQ3) | $115,337 | $98,105 |
| Interquartile Range (IQR) | $38,808 | $32,993 |
| Standard Deviation (Sample) | $32,098 | $20,832 |
| Standard Deviation (Population) | $31,889 | $20,482 |
Demographics Similar to Immigrants from Uzbekistan and Immigrants from Oceania by Householder Income Ages 25 - 44 years
In terms of householder income ages 25 - 44 years, the demographic groups most similar to Immigrants from Uzbekistan are Peruvian ($98,886, a difference of 0.040%), Palestinian ($98,777, a difference of 0.070%), Zimbabwean ($98,586, a difference of 0.27%), Swedish ($99,136, a difference of 0.29%), and Jordanian ($99,186, a difference of 0.34%). Similarly, the demographic groups most similar to Immigrants from Oceania are Canadian ($97,625, a difference of 0.0%), Hungarian ($97,544, a difference of 0.080%), Tsimshian ($97,809, a difference of 0.19%), Immigrants from Zimbabwe ($97,880, a difference of 0.26%), and Lebanese ($97,339, a difference of 0.29%).
| Demographics | Rating | Rank | Householder Income Ages 25 - 44 years |
| Syrians | 92.9 /100 | #118 | Exceptional $99,215 |
| Jordanians | 92.8 /100 | #119 | Exceptional $99,186 |
| Swedes | 92.7 /100 | #120 | Exceptional $99,136 |
| Peruvians | 91.7 /100 | #121 | Exceptional $98,886 |
| Immigrants | Uzbekistan | 91.5 /100 | #122 | Exceptional $98,849 |
| Palestinians | 91.2 /100 | #123 | Exceptional $98,777 |
| Zimbabweans | 90.3 /100 | #124 | Exceptional $98,586 |
| Pakistanis | 89.3 /100 | #125 | Excellent $98,401 |
| British | 89.1 /100 | #126 | Excellent $98,359 |
| Serbians | 88.9 /100 | #127 | Excellent $98,320 |
| Europeans | 88.9 /100 | #128 | Excellent $98,310 |
| Brazilians | 88.6 /100 | #129 | Excellent $98,267 |
| Immigrants | Kuwait | 87.8 /100 | #130 | Excellent $98,122 |
| Immigrants | Albania | 86.6 /100 | #131 | Excellent $97,929 |
| Immigrants | Zimbabwe | 86.3 /100 | #132 | Excellent $97,880 |
| Tsimshian | 85.8 /100 | #133 | Excellent $97,809 |
| Canadians | 84.5 /100 | #134 | Excellent $97,625 |
| Immigrants | Oceania | 84.5 /100 | #135 | Excellent $97,623 |
| Hungarians | 83.9 /100 | #136 | Excellent $97,544 |
| Lebanese | 82.3 /100 | #137 | Excellent $97,339 |
| Arabs | 82.3 /100 | #138 | Excellent $97,336 |