Immigrants from Uzbekistan vs Immigrants from Eastern Africa Householder Income Ages 25 - 44 years
COMPARE
Immigrants from Uzbekistan
Immigrants from Eastern Africa
Householder Income Ages 25 - 44 years
Householder Income Ages 25 - 44 years Comparison
Immigrants from Uzbekistan
Immigrants from Eastern Africa
$98,849
HOUSEHOLDER INCOME AGES 25 - 44 YEARS
91.5/ 100
METRIC RATING
122nd/ 347
METRIC RANK
$91,458
HOUSEHOLDER INCOME AGES 25 - 44 YEARS
15.2/ 100
METRIC RATING
205th/ 347
METRIC RANK
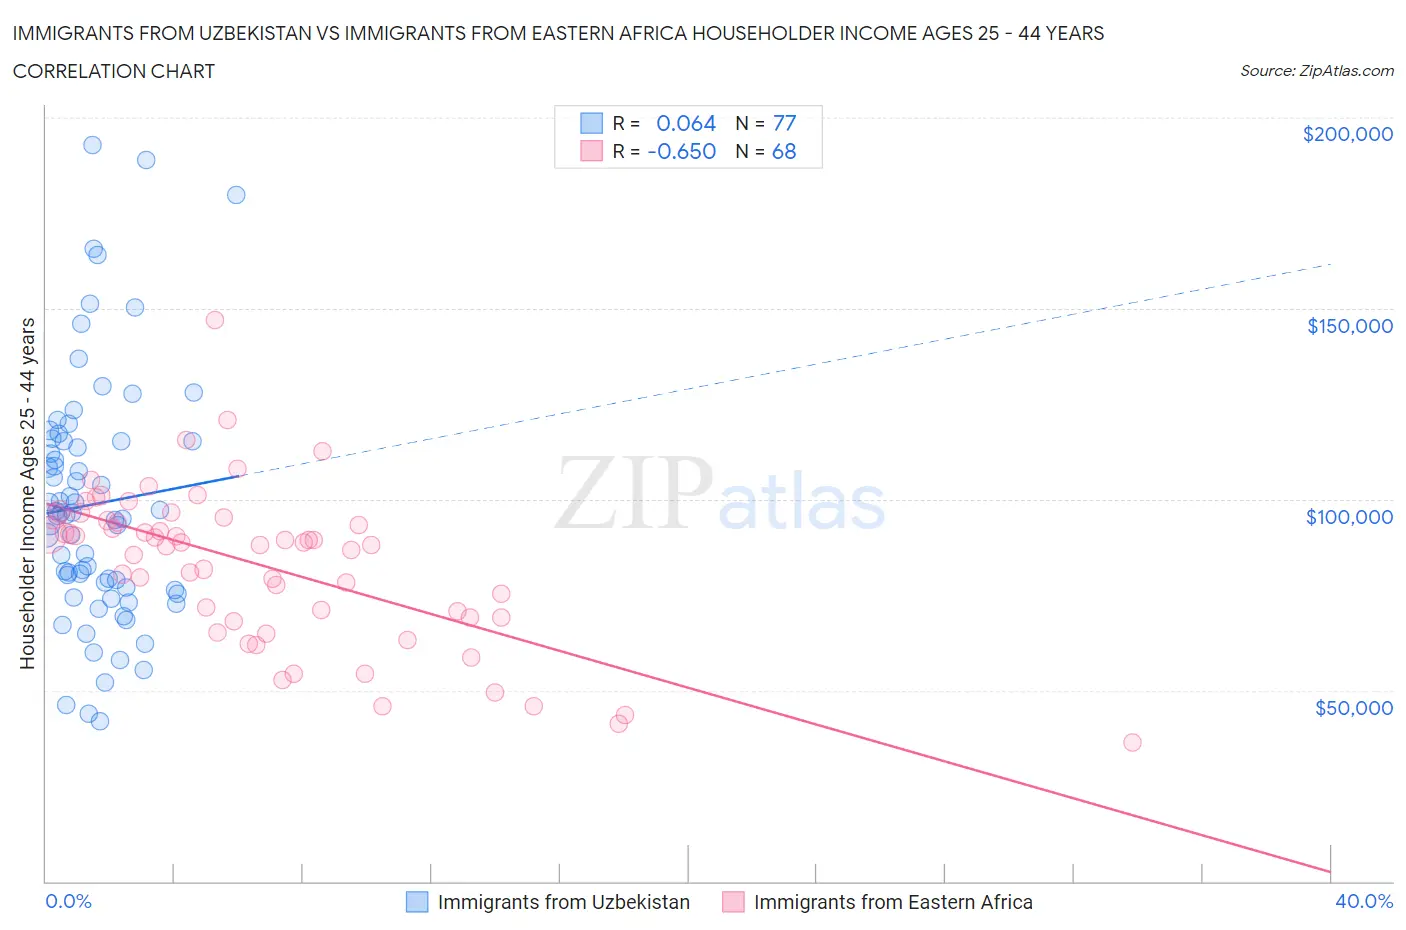
Immigrants from Uzbekistan vs Immigrants from Eastern Africa Householder Income Ages 25 - 44 years Correlation Chart
The statistical analysis conducted on geographies consisting of 118,660,152 people shows a slight positive correlation between the proportion of Immigrants from Uzbekistan and household income with householder between the ages 25 and 44 in the United States with a correlation coefficient (R) of 0.064 and weighted average of $98,849. Similarly, the statistical analysis conducted on geographies consisting of 354,447,145 people shows a significant negative correlation between the proportion of Immigrants from Eastern Africa and household income with householder between the ages 25 and 44 in the United States with a correlation coefficient (R) of -0.650 and weighted average of $91,458, a difference of 8.1%.
Householder Income Ages 25 - 44 years Correlation Summary
| Measurement | Immigrants from Uzbekistan | Immigrants from Eastern Africa |
| Minimum | $41,890 | $36,409 |
| Maximum | $192,849 | $146,936 |
| Range | $150,959 | $110,527 |
| Mean | $98,791 | $82,778 |
| Median | $95,849 | $88,339 |
| Interquartile 25% (IQ1) | $76,528 | $69,093 |
| Interquartile 75% (IQ3) | $115,337 | $94,875 |
| Interquartile Range (IQR) | $38,808 | $25,782 |
| Standard Deviation (Sample) | $32,098 | $20,521 |
| Standard Deviation (Population) | $31,889 | $20,370 |
Similar Demographics by Householder Income Ages 25 - 44 years
Demographics Similar to Immigrants from Uzbekistan by Householder Income Ages 25 - 44 years
In terms of householder income ages 25 - 44 years, the demographic groups most similar to Immigrants from Uzbekistan are Peruvian ($98,886, a difference of 0.040%), Palestinian ($98,777, a difference of 0.070%), Zimbabwean ($98,586, a difference of 0.27%), Swedish ($99,136, a difference of 0.29%), and Jordanian ($99,186, a difference of 0.34%).
| Demographics | Rating | Rank | Householder Income Ages 25 - 44 years |
| Carpatho Rusyns | 93.7 /100 | #115 | Exceptional $99,449 |
| Portuguese | 93.7 /100 | #116 | Exceptional $99,429 |
| Immigrants | Northern Africa | 93.0 /100 | #117 | Exceptional $99,232 |
| Syrians | 92.9 /100 | #118 | Exceptional $99,215 |
| Jordanians | 92.8 /100 | #119 | Exceptional $99,186 |
| Swedes | 92.7 /100 | #120 | Exceptional $99,136 |
| Peruvians | 91.7 /100 | #121 | Exceptional $98,886 |
| Immigrants | Uzbekistan | 91.5 /100 | #122 | Exceptional $98,849 |
| Palestinians | 91.2 /100 | #123 | Exceptional $98,777 |
| Zimbabweans | 90.3 /100 | #124 | Exceptional $98,586 |
| Pakistanis | 89.3 /100 | #125 | Excellent $98,401 |
| British | 89.1 /100 | #126 | Excellent $98,359 |
| Serbians | 88.9 /100 | #127 | Excellent $98,320 |
| Europeans | 88.9 /100 | #128 | Excellent $98,310 |
| Brazilians | 88.6 /100 | #129 | Excellent $98,267 |
Demographics Similar to Immigrants from Eastern Africa by Householder Income Ages 25 - 44 years
In terms of householder income ages 25 - 44 years, the demographic groups most similar to Immigrants from Eastern Africa are Nepalese ($91,498, a difference of 0.040%), Immigrants from Cambodia ($91,533, a difference of 0.080%), Aleut ($91,370, a difference of 0.10%), Yugoslavian ($91,368, a difference of 0.10%), and Ecuadorian ($91,574, a difference of 0.13%).
| Demographics | Rating | Rank | Householder Income Ages 25 - 44 years |
| Vietnamese | 20.2 /100 | #198 | Fair $92,089 |
| Kenyans | 16.8 /100 | #199 | Poor $91,684 |
| Whites/Caucasians | 16.7 /100 | #200 | Poor $91,668 |
| Japanese | 16.4 /100 | #201 | Poor $91,624 |
| Ecuadorians | 16.0 /100 | #202 | Poor $91,574 |
| Immigrants | Cambodia | 15.7 /100 | #203 | Poor $91,533 |
| Nepalese | 15.4 /100 | #204 | Poor $91,498 |
| Immigrants | Eastern Africa | 15.2 /100 | #205 | Poor $91,458 |
| Aleuts | 14.5 /100 | #206 | Poor $91,370 |
| Yugoslavians | 14.5 /100 | #207 | Poor $91,368 |
| Immigrants | Thailand | 14.3 /100 | #208 | Poor $91,337 |
| Immigrants | Uruguay | 13.2 /100 | #209 | Poor $91,171 |
| Immigrants | Kenya | 10.9 /100 | #210 | Poor $90,767 |
| Iraqis | 10.8 /100 | #211 | Poor $90,764 |
| Hawaiians | 10.6 /100 | #212 | Poor $90,722 |