Immigrants from Switzerland vs Immigrants from Greece Wage/Income Gap
COMPARE
Immigrants from Switzerland
Immigrants from Greece
Wage/Income Gap
Wage/Income Gap Comparison
Immigrants from Switzerland
Immigrants from Greece
27.7%
WAGE/INCOME GAP
1.0/ 100
METRIC RATING
264th/ 347
METRIC RANK
25.7%
WAGE/INCOME GAP
56.6/ 100
METRIC RATING
171st/ 347
METRIC RANK
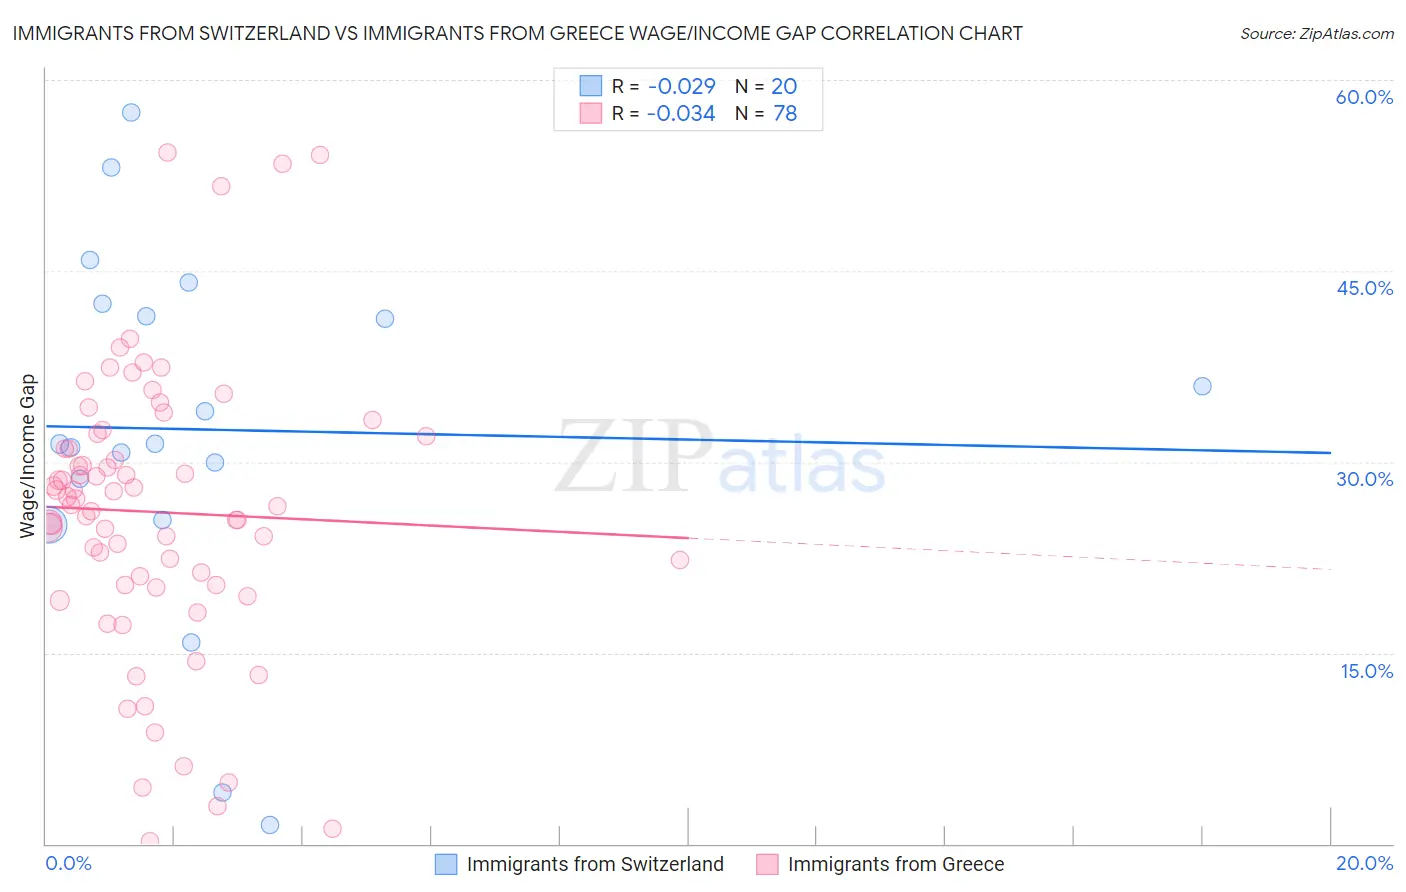
Immigrants from Switzerland vs Immigrants from Greece Wage/Income Gap Correlation Chart
The statistical analysis conducted on geographies consisting of 148,012,868 people shows no correlation between the proportion of Immigrants from Switzerland and wage/income gap percentage in the United States with a correlation coefficient (R) of -0.029 and weighted average of 27.7%. Similarly, the statistical analysis conducted on geographies consisting of 216,813,156 people shows no correlation between the proportion of Immigrants from Greece and wage/income gap percentage in the United States with a correlation coefficient (R) of -0.034 and weighted average of 25.7%, a difference of 7.9%.
Wage/Income Gap Correlation Summary
| Measurement | Immigrants from Switzerland | Immigrants from Greece |
| Minimum | 1.5% | 0.24% |
| Maximum | 57.5% | 54.3% |
| Range | 56.0% | 54.0% |
| Mean | 32.5% | 26.1% |
| Median | 31.4% | 26.8% |
| Interquartile 25% (IQ1) | 27.1% | 20.3% |
| Interquartile 75% (IQ3) | 42.0% | 32.0% |
| Interquartile Range (IQR) | 14.9% | 11.7% |
| Standard Deviation (Sample) | 14.2% | 11.2% |
| Standard Deviation (Population) | 13.8% | 11.1% |
Similar Demographics by Wage/Income Gap
Demographics Similar to Immigrants from Switzerland by Wage/Income Gap
In terms of wage/income gap, the demographic groups most similar to Immigrants from Switzerland are Serbian (27.7%, a difference of 0.0%), Hmong (27.7%, a difference of 0.010%), Turkish (27.7%, a difference of 0.020%), New Zealander (27.7%, a difference of 0.10%), and Potawatomi (27.7%, a difference of 0.12%).
| Demographics | Rating | Rank | Wage/Income Gap |
| Luxembourgers | 1.9 /100 | #257 | Tragic 27.4% |
| Slavs | 1.8 /100 | #258 | Tragic 27.4% |
| Icelanders | 1.8 /100 | #259 | Tragic 27.5% |
| Tongans | 1.7 /100 | #260 | Tragic 27.5% |
| Immigrants | Germany | 1.5 /100 | #261 | Tragic 27.5% |
| Immigrants | Lebanon | 1.5 /100 | #262 | Tragic 27.5% |
| Syrians | 1.4 /100 | #263 | Tragic 27.6% |
| Immigrants | Switzerland | 1.0 /100 | #264 | Tragic 27.7% |
| Serbians | 1.0 /100 | #265 | Tragic 27.7% |
| Hmong | 1.0 /100 | #266 | Tragic 27.7% |
| Turks | 1.0 /100 | #267 | Tragic 27.7% |
| New Zealanders | 1.0 /100 | #268 | Tragic 27.7% |
| Potawatomi | 0.9 /100 | #269 | Tragic 27.7% |
| Immigrants | Western Europe | 0.9 /100 | #270 | Tragic 27.8% |
| Ute | 0.8 /100 | #271 | Tragic 27.8% |
Demographics Similar to Immigrants from Greece by Wage/Income Gap
In terms of wage/income gap, the demographic groups most similar to Immigrants from Greece are Immigrants from Oceania (25.6%, a difference of 0.060%), Immigrants from Chile (25.7%, a difference of 0.22%), Peruvian (25.6%, a difference of 0.23%), Immigrants from Belarus (25.7%, a difference of 0.24%), and Seminole (25.6%, a difference of 0.41%).
| Demographics | Rating | Rank | Wage/Income Gap |
| Koreans | 68.6 /100 | #164 | Good 25.4% |
| Immigrants | Hong Kong | 64.0 /100 | #165 | Good 25.5% |
| Immigrants | Ukraine | 63.8 /100 | #166 | Good 25.5% |
| Paiute | 62.9 /100 | #167 | Good 25.5% |
| Seminole | 62.6 /100 | #168 | Good 25.6% |
| Peruvians | 60.1 /100 | #169 | Good 25.6% |
| Immigrants | Oceania | 57.5 /100 | #170 | Average 25.6% |
| Immigrants | Greece | 56.6 /100 | #171 | Average 25.7% |
| Immigrants | Chile | 53.2 /100 | #172 | Average 25.7% |
| Immigrants | Belarus | 52.9 /100 | #173 | Average 25.7% |
| Alaskan Athabascans | 50.0 /100 | #174 | Average 25.8% |
| Sri Lankans | 47.0 /100 | #175 | Average 25.8% |
| Paraguayans | 46.7 /100 | #176 | Average 25.8% |
| Cambodians | 45.1 /100 | #177 | Average 25.8% |
| Chinese | 42.0 /100 | #178 | Average 25.9% |