Immigrants from Sweden vs Immigrants from Germany Wage/Income Gap
COMPARE
Immigrants from Sweden
Immigrants from Germany
Wage/Income Gap
Wage/Income Gap Comparison
Immigrants from Sweden
Immigrants from Germany
28.1%
WAGE/INCOME GAP
0.4/ 100
METRIC RATING
284th/ 347
METRIC RANK
27.5%
WAGE/INCOME GAP
1.5/ 100
METRIC RATING
261st/ 347
METRIC RANK
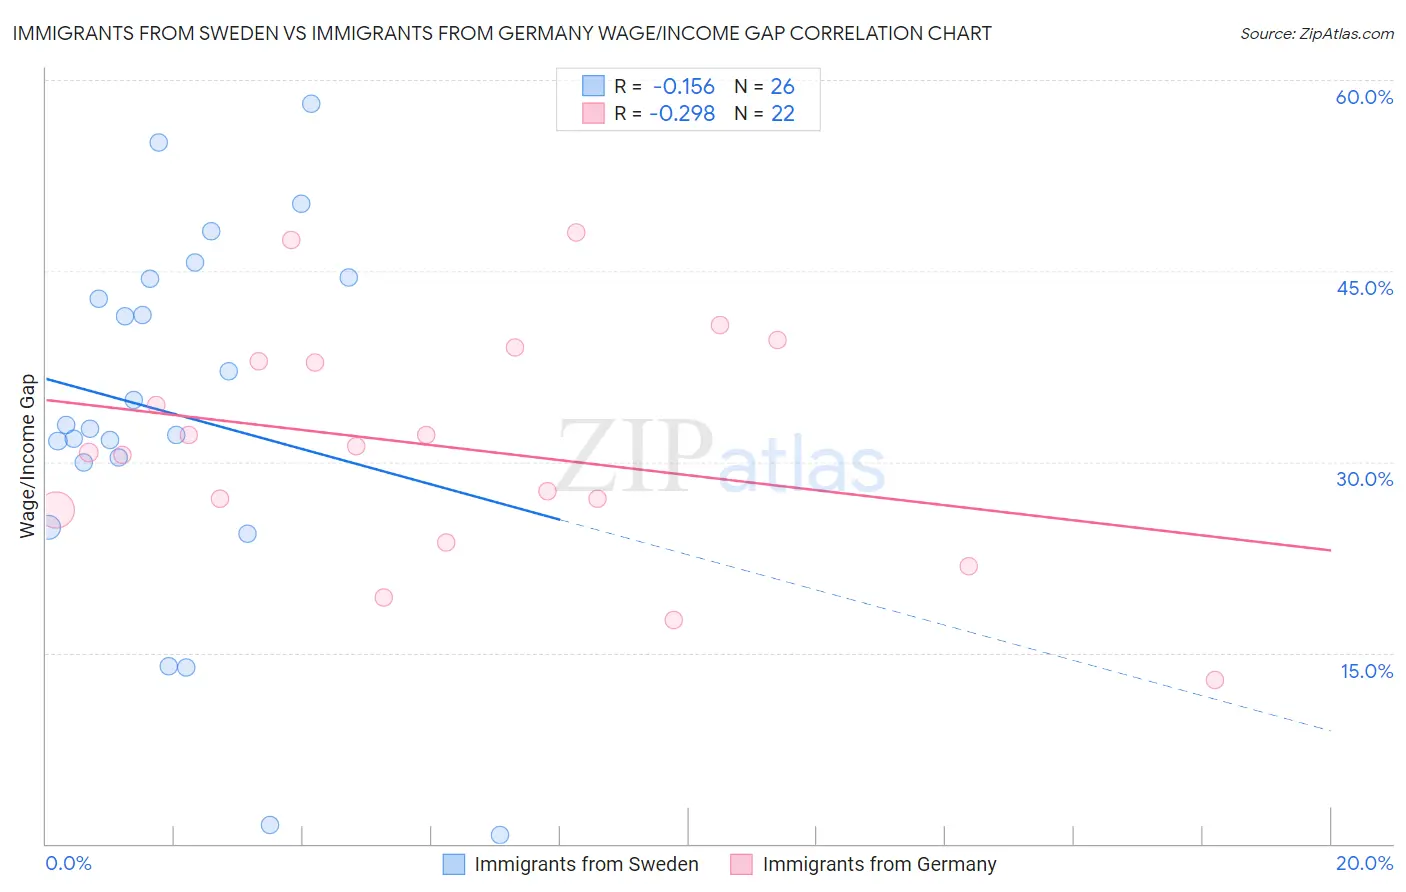
Immigrants from Sweden vs Immigrants from Germany Wage/Income Gap Correlation Chart
The statistical analysis conducted on geographies consisting of 164,690,992 people shows a poor negative correlation between the proportion of Immigrants from Sweden and wage/income gap percentage in the United States with a correlation coefficient (R) of -0.156 and weighted average of 28.1%. Similarly, the statistical analysis conducted on geographies consisting of 463,246,314 people shows a weak negative correlation between the proportion of Immigrants from Germany and wage/income gap percentage in the United States with a correlation coefficient (R) of -0.298 and weighted average of 27.5%, a difference of 1.9%.
Wage/Income Gap Correlation Summary
| Measurement | Immigrants from Sweden | Immigrants from Germany |
| Minimum | 0.69% | 12.9% |
| Maximum | 58.2% | 48.0% |
| Range | 57.5% | 35.1% |
| Mean | 33.7% | 31.1% |
| Median | 32.8% | 31.0% |
| Interquartile 25% (IQ1) | 30.0% | 26.3% |
| Interquartile 75% (IQ3) | 44.4% | 37.9% |
| Interquartile Range (IQR) | 14.4% | 11.6% |
| Standard Deviation (Sample) | 14.5% | 9.1% |
| Standard Deviation (Population) | 14.2% | 8.9% |
Similar Demographics by Wage/Income Gap
Demographics Similar to Immigrants from Sweden by Wage/Income Gap
In terms of wage/income gap, the demographic groups most similar to Immigrants from Sweden are French Canadian (28.1%, a difference of 0.010%), Italian (28.1%, a difference of 0.13%), Immigrants from Austria (28.1%, a difference of 0.16%), South African (28.0%, a difference of 0.18%), and Okinawan (28.1%, a difference of 0.19%).
| Demographics | Rating | Rank | Wage/Income Gap |
| Latvians | 0.7 /100 | #277 | Tragic 27.9% |
| Immigrants | England | 0.6 /100 | #278 | Tragic 27.9% |
| Romanians | 0.5 /100 | #279 | Tragic 28.0% |
| Russians | 0.5 /100 | #280 | Tragic 28.0% |
| Burmese | 0.5 /100 | #281 | Tragic 28.0% |
| South Africans | 0.5 /100 | #282 | Tragic 28.0% |
| French Canadians | 0.4 /100 | #283 | Tragic 28.1% |
| Immigrants | Sweden | 0.4 /100 | #284 | Tragic 28.1% |
| Italians | 0.4 /100 | #285 | Tragic 28.1% |
| Immigrants | Austria | 0.4 /100 | #286 | Tragic 28.1% |
| Okinawans | 0.4 /100 | #287 | Tragic 28.1% |
| Choctaw | 0.4 /100 | #288 | Tragic 28.1% |
| Canadians | 0.3 /100 | #289 | Tragic 28.1% |
| Australians | 0.3 /100 | #290 | Tragic 28.2% |
| Czechoslovakians | 0.3 /100 | #291 | Tragic 28.2% |
Demographics Similar to Immigrants from Germany by Wage/Income Gap
In terms of wage/income gap, the demographic groups most similar to Immigrants from Germany are Immigrants from Lebanon (27.5%, a difference of 0.010%), Syrian (27.6%, a difference of 0.10%), Tongan (27.5%, a difference of 0.26%), Icelander (27.5%, a difference of 0.28%), and Slavic (27.4%, a difference of 0.36%).
| Demographics | Rating | Rank | Wage/Income Gap |
| Israelis | 2.1 /100 | #254 | Tragic 27.4% |
| Immigrants | France | 2.1 /100 | #255 | Tragic 27.4% |
| Cherokee | 1.9 /100 | #256 | Tragic 27.4% |
| Luxembourgers | 1.9 /100 | #257 | Tragic 27.4% |
| Slavs | 1.8 /100 | #258 | Tragic 27.4% |
| Icelanders | 1.8 /100 | #259 | Tragic 27.5% |
| Tongans | 1.7 /100 | #260 | Tragic 27.5% |
| Immigrants | Germany | 1.5 /100 | #261 | Tragic 27.5% |
| Immigrants | Lebanon | 1.5 /100 | #262 | Tragic 27.5% |
| Syrians | 1.4 /100 | #263 | Tragic 27.6% |
| Immigrants | Switzerland | 1.0 /100 | #264 | Tragic 27.7% |
| Serbians | 1.0 /100 | #265 | Tragic 27.7% |
| Hmong | 1.0 /100 | #266 | Tragic 27.7% |
| Turks | 1.0 /100 | #267 | Tragic 27.7% |
| New Zealanders | 1.0 /100 | #268 | Tragic 27.7% |