Immigrants from Sweden vs Immigrants from France Householder Income Ages 25 - 44 years
COMPARE
Immigrants from Sweden
Immigrants from France
Householder Income Ages 25 - 44 years
Householder Income Ages 25 - 44 years Comparison
Immigrants from Sweden
Immigrants from France
$112,010
HOUSEHOLDER INCOME AGES 25 - 44 YEARS
100.0/ 100
METRIC RATING
24th/ 347
METRIC RANK
$108,257
HOUSEHOLDER INCOME AGES 25 - 44 YEARS
99.9/ 100
METRIC RATING
39th/ 347
METRIC RANK
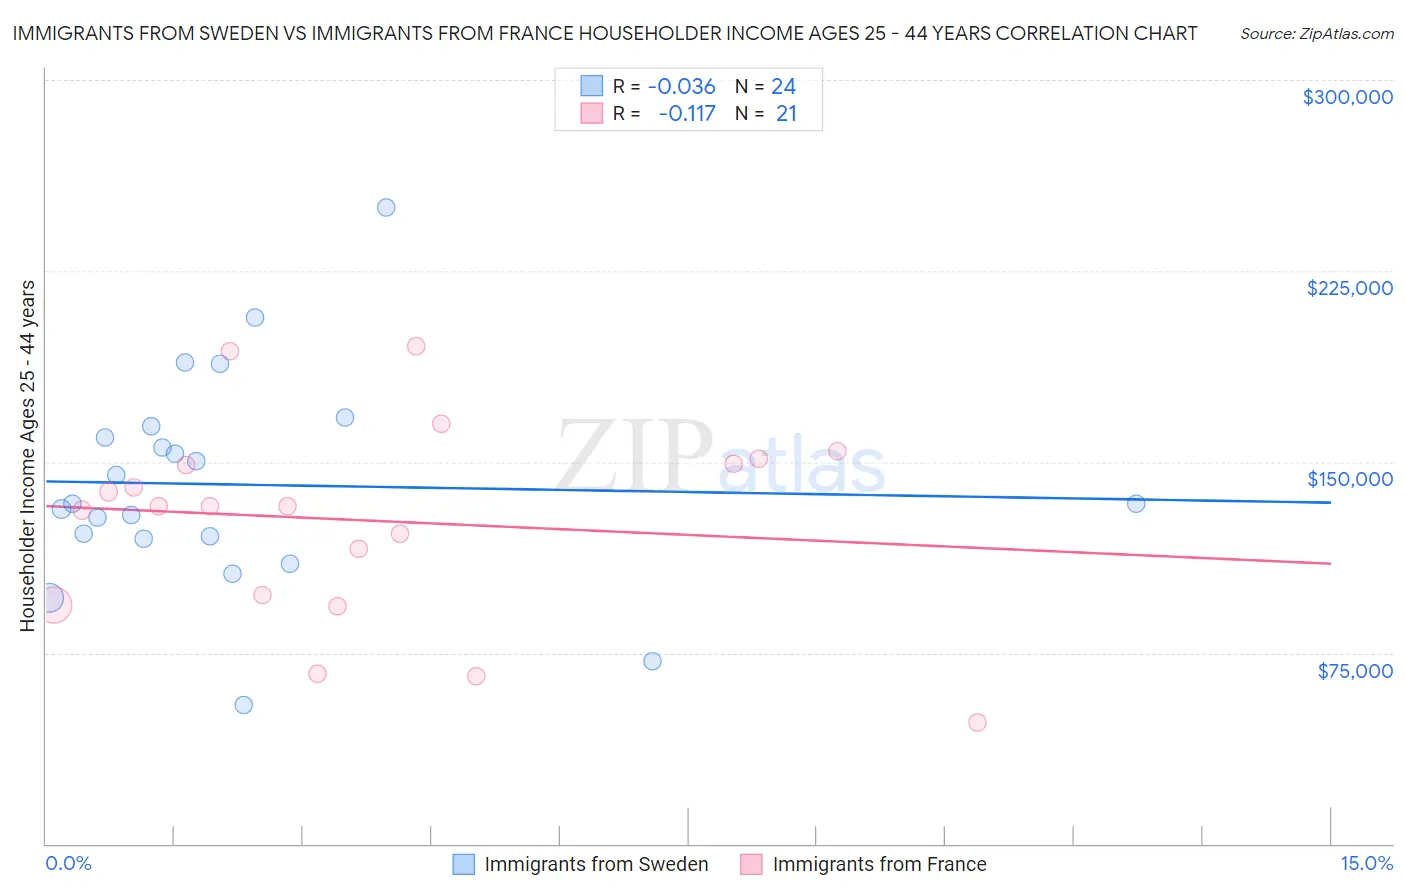
Immigrants from Sweden vs Immigrants from France Householder Income Ages 25 - 44 years Correlation Chart
The statistical analysis conducted on geographies consisting of 164,402,876 people shows no correlation between the proportion of Immigrants from Sweden and household income with householder between the ages 25 and 44 in the United States with a correlation coefficient (R) of -0.036 and weighted average of $112,010. Similarly, the statistical analysis conducted on geographies consisting of 287,397,429 people shows a poor negative correlation between the proportion of Immigrants from France and household income with householder between the ages 25 and 44 in the United States with a correlation coefficient (R) of -0.117 and weighted average of $108,257, a difference of 3.5%.
Householder Income Ages 25 - 44 years Correlation Summary
| Measurement | Immigrants from Sweden | Immigrants from France |
| Minimum | $54,583 | $47,500 |
| Maximum | $250,001 | $195,321 |
| Range | $195,418 | $147,821 |
| Mean | $141,082 | $126,914 |
| Median | $133,512 | $132,431 |
| Interquartile 25% (IQ1) | $120,320 | $95,699 |
| Interquartile 75% (IQ3) | $161,851 | $150,220 |
| Interquartile Range (IQR) | $41,531 | $54,521 |
| Standard Deviation (Sample) | $42,161 | $38,836 |
| Standard Deviation (Population) | $41,274 | $37,900 |
Demographics Similar to Immigrants from Sweden and Immigrants from France by Householder Income Ages 25 - 44 years
In terms of householder income ages 25 - 44 years, the demographic groups most similar to Immigrants from Sweden are Immigrants from Japan ($112,228, a difference of 0.19%), Immigrants from Northern Europe ($111,676, a difference of 0.30%), Immigrants from Belgium ($112,575, a difference of 0.50%), Asian ($112,666, a difference of 0.59%), and Immigrants from Asia ($110,787, a difference of 1.1%). Similarly, the demographic groups most similar to Immigrants from France are Immigrants from Lithuania ($108,149, a difference of 0.10%), Immigrants from Bolivia ($108,128, a difference of 0.12%), Soviet Union ($108,457, a difference of 0.18%), Immigrants from Russia ($108,751, a difference of 0.46%), and Latvian ($108,926, a difference of 0.62%).
| Demographics | Rating | Rank | Householder Income Ages 25 - 44 years |
| Asians | 100.0 /100 | #21 | Exceptional $112,666 |
| Immigrants | Belgium | 100.0 /100 | #22 | Exceptional $112,575 |
| Immigrants | Japan | 100.0 /100 | #23 | Exceptional $112,228 |
| Immigrants | Sweden | 100.0 /100 | #24 | Exceptional $112,010 |
| Immigrants | Northern Europe | 100.0 /100 | #25 | Exceptional $111,676 |
| Immigrants | Asia | 100.0 /100 | #26 | Exceptional $110,787 |
| Russians | 100.0 /100 | #27 | Exceptional $110,398 |
| Immigrants | Denmark | 100.0 /100 | #28 | Exceptional $110,363 |
| Turks | 100.0 /100 | #29 | Exceptional $110,318 |
| Immigrants | Greece | 100.0 /100 | #30 | Exceptional $110,103 |
| Maltese | 100.0 /100 | #31 | Exceptional $110,064 |
| Immigrants | Sri Lanka | 100.0 /100 | #32 | Exceptional $109,741 |
| Bhutanese | 100.0 /100 | #33 | Exceptional $109,520 |
| Bolivians | 100.0 /100 | #34 | Exceptional $109,372 |
| Immigrants | Switzerland | 100.0 /100 | #35 | Exceptional $109,185 |
| Latvians | 100.0 /100 | #36 | Exceptional $108,926 |
| Immigrants | Russia | 100.0 /100 | #37 | Exceptional $108,751 |
| Soviet Union | 100.0 /100 | #38 | Exceptional $108,457 |
| Immigrants | France | 99.9 /100 | #39 | Exceptional $108,257 |
| Immigrants | Lithuania | 99.9 /100 | #40 | Exceptional $108,149 |
| Immigrants | Bolivia | 99.9 /100 | #41 | Exceptional $108,128 |