Immigrants from Armenia vs Immigrants from France Householder Income Ages 25 - 44 years
COMPARE
Immigrants from Armenia
Immigrants from France
Householder Income Ages 25 - 44 years
Householder Income Ages 25 - 44 years Comparison
Immigrants from Armenia
Immigrants from France
$94,867
HOUSEHOLDER INCOME AGES 25 - 44 YEARS
54.2/ 100
METRIC RATING
171st/ 347
METRIC RANK
$108,257
HOUSEHOLDER INCOME AGES 25 - 44 YEARS
99.9/ 100
METRIC RATING
39th/ 347
METRIC RANK
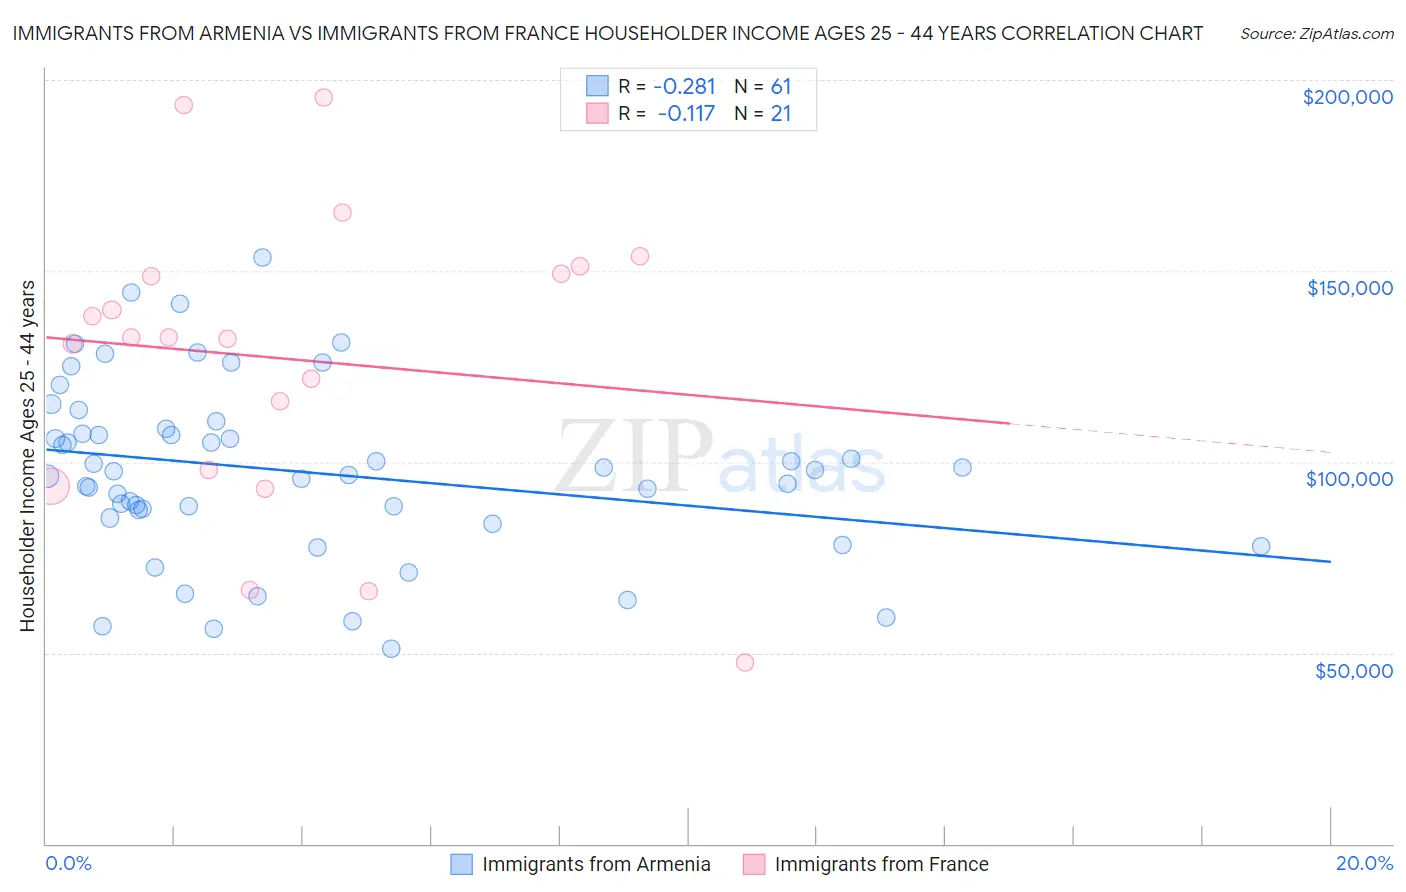
Immigrants from Armenia vs Immigrants from France Householder Income Ages 25 - 44 years Correlation Chart
The statistical analysis conducted on geographies consisting of 97,704,763 people shows a weak negative correlation between the proportion of Immigrants from Armenia and household income with householder between the ages 25 and 44 in the United States with a correlation coefficient (R) of -0.281 and weighted average of $94,867. Similarly, the statistical analysis conducted on geographies consisting of 287,397,429 people shows a poor negative correlation between the proportion of Immigrants from France and household income with householder between the ages 25 and 44 in the United States with a correlation coefficient (R) of -0.117 and weighted average of $108,257, a difference of 14.1%.
Householder Income Ages 25 - 44 years Correlation Summary
| Measurement | Immigrants from Armenia | Immigrants from France |
| Minimum | $50,938 | $47,500 |
| Maximum | $153,486 | $195,321 |
| Range | $102,548 | $147,821 |
| Mean | $97,387 | $126,914 |
| Median | $97,643 | $132,431 |
| Interquartile 25% (IQ1) | $86,360 | $95,699 |
| Interquartile 75% (IQ3) | $108,002 | $150,220 |
| Interquartile Range (IQR) | $21,642 | $54,521 |
| Standard Deviation (Sample) | $22,751 | $38,836 |
| Standard Deviation (Population) | $22,564 | $37,900 |
Similar Demographics by Householder Income Ages 25 - 44 years
Demographics Similar to Immigrants from Armenia by Householder Income Ages 25 - 44 years
In terms of householder income ages 25 - 44 years, the demographic groups most similar to Immigrants from Armenia are Slovak ($95,032, a difference of 0.17%), Alsatian ($95,059, a difference of 0.20%), Native Hawaiian ($95,058, a difference of 0.20%), Czechoslovakian ($95,070, a difference of 0.21%), and Scottish ($94,622, a difference of 0.26%).
| Demographics | Rating | Rank | Householder Income Ages 25 - 44 years |
| South Americans | 60.9 /100 | #164 | Good $95,362 |
| Immigrants | Nepal | 60.3 /100 | #165 | Good $95,322 |
| Immigrants | Ethiopia | 59.5 /100 | #166 | Average $95,256 |
| Czechoslovakians | 57.0 /100 | #167 | Average $95,070 |
| Alsatians | 56.8 /100 | #168 | Average $95,059 |
| Native Hawaiians | 56.8 /100 | #169 | Average $95,058 |
| Slovaks | 56.4 /100 | #170 | Average $95,032 |
| Immigrants | Armenia | 54.2 /100 | #171 | Average $94,867 |
| Scottish | 50.8 /100 | #172 | Average $94,622 |
| Finns | 50.6 /100 | #173 | Average $94,610 |
| Colombians | 50.0 /100 | #174 | Average $94,565 |
| English | 48.1 /100 | #175 | Average $94,429 |
| Immigrants | Immigrants | 48.0 /100 | #176 | Average $94,423 |
| Belgians | 45.8 /100 | #177 | Average $94,262 |
| Immigrants | South America | 42.8 /100 | #178 | Average $94,042 |
Demographics Similar to Immigrants from France by Householder Income Ages 25 - 44 years
In terms of householder income ages 25 - 44 years, the demographic groups most similar to Immigrants from France are Immigrants from Lithuania ($108,149, a difference of 0.10%), Immigrants from Bolivia ($108,128, a difference of 0.12%), Soviet Union ($108,457, a difference of 0.18%), Australian ($107,912, a difference of 0.32%), and Immigrants from Russia ($108,751, a difference of 0.46%).
| Demographics | Rating | Rank | Householder Income Ages 25 - 44 years |
| Immigrants | Sri Lanka | 100.0 /100 | #32 | Exceptional $109,741 |
| Bhutanese | 100.0 /100 | #33 | Exceptional $109,520 |
| Bolivians | 100.0 /100 | #34 | Exceptional $109,372 |
| Immigrants | Switzerland | 100.0 /100 | #35 | Exceptional $109,185 |
| Latvians | 100.0 /100 | #36 | Exceptional $108,926 |
| Immigrants | Russia | 100.0 /100 | #37 | Exceptional $108,751 |
| Soviet Union | 100.0 /100 | #38 | Exceptional $108,457 |
| Immigrants | France | 99.9 /100 | #39 | Exceptional $108,257 |
| Immigrants | Lithuania | 99.9 /100 | #40 | Exceptional $108,149 |
| Immigrants | Bolivia | 99.9 /100 | #41 | Exceptional $108,128 |
| Australians | 99.9 /100 | #42 | Exceptional $107,912 |
| Immigrants | Malaysia | 99.9 /100 | #43 | Exceptional $107,650 |
| Immigrants | Indonesia | 99.9 /100 | #44 | Exceptional $107,627 |
| Israelis | 99.9 /100 | #45 | Exceptional $107,579 |
| Immigrants | Belarus | 99.9 /100 | #46 | Exceptional $107,393 |