Immigrants from South Eastern Asia vs Vietnamese Median Household Income
COMPARE
Immigrants from South Eastern Asia
Vietnamese
Median Household Income
Median Household Income Comparison
Immigrants from South Eastern Asia
Vietnamese
$91,541
MEDIAN HOUSEHOLD INCOME
98.4/ 100
METRIC RATING
99th/ 347
METRIC RANK
$82,248
MEDIAN HOUSEHOLD INCOME
13.8/ 100
METRIC RATING
215th/ 347
METRIC RANK
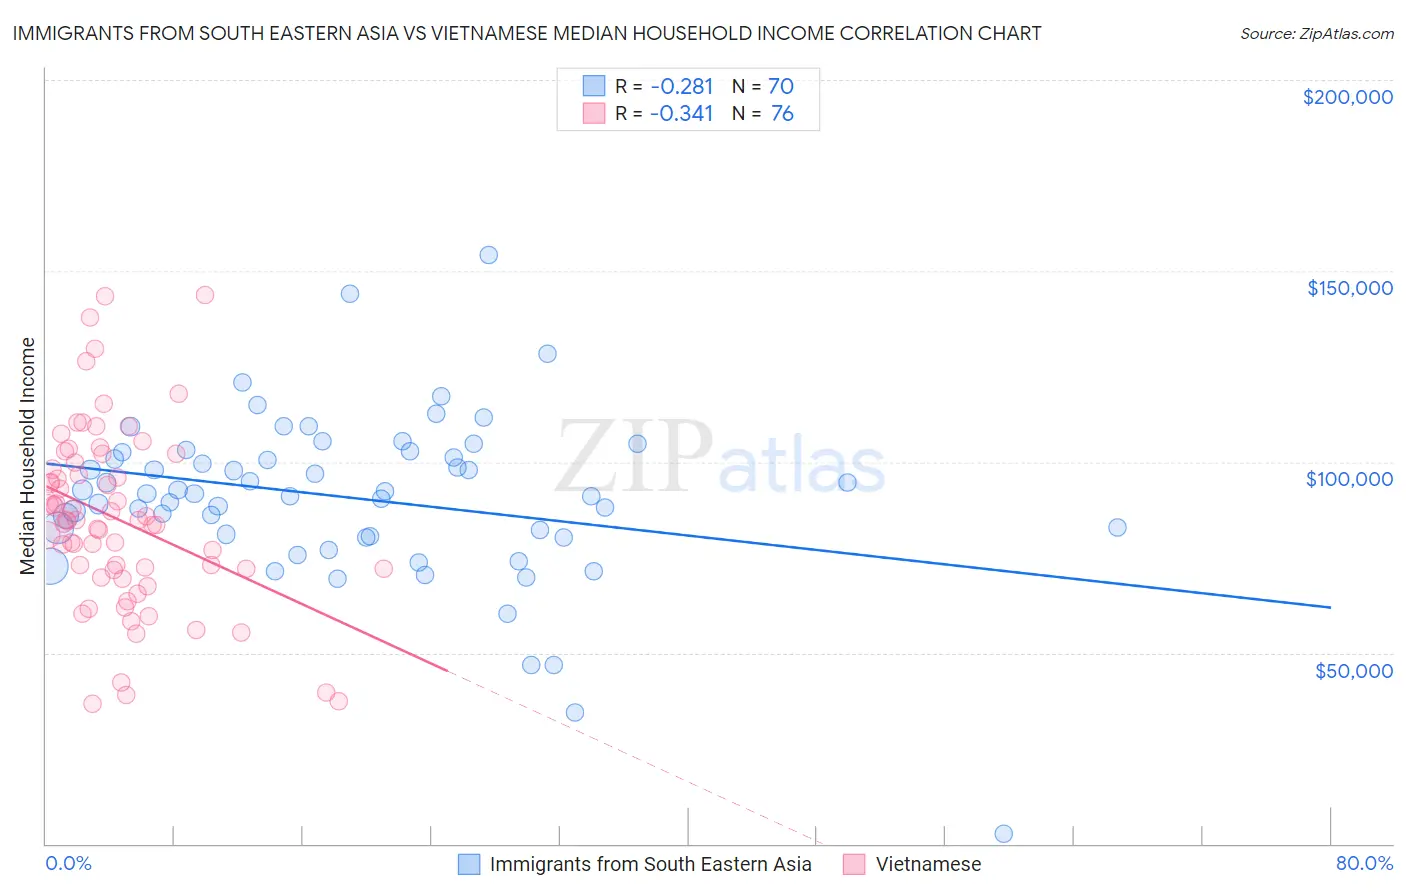
Immigrants from South Eastern Asia vs Vietnamese Median Household Income Correlation Chart
The statistical analysis conducted on geographies consisting of 511,972,128 people shows a weak negative correlation between the proportion of Immigrants from South Eastern Asia and median household income in the United States with a correlation coefficient (R) of -0.281 and weighted average of $91,541. Similarly, the statistical analysis conducted on geographies consisting of 170,624,806 people shows a mild negative correlation between the proportion of Vietnamese and median household income in the United States with a correlation coefficient (R) of -0.341 and weighted average of $82,248, a difference of 11.3%.
Median Household Income Correlation Summary
| Measurement | Immigrants from South Eastern Asia | Vietnamese |
| Minimum | $2,499 | $36,578 |
| Maximum | $154,011 | $143,859 |
| Range | $151,512 | $107,281 |
| Mean | $90,562 | $84,974 |
| Median | $91,713 | $84,533 |
| Interquartile 25% (IQ1) | $80,662 | $71,810 |
| Interquartile 75% (IQ3) | $102,441 | $98,943 |
| Interquartile Range (IQR) | $21,780 | $27,134 |
| Standard Deviation (Sample) | $22,276 | $23,335 |
| Standard Deviation (Population) | $22,116 | $23,181 |
Similar Demographics by Median Household Income
Demographics Similar to Immigrants from South Eastern Asia by Median Household Income
In terms of median household income, the demographic groups most similar to Immigrants from South Eastern Asia are Immigrants from Southern Europe ($91,605, a difference of 0.070%), Ukrainian ($91,456, a difference of 0.090%), Immigrants from Moldova ($91,446, a difference of 0.10%), Immigrants from Serbia ($91,730, a difference of 0.21%), and Austrian ($91,339, a difference of 0.22%).
| Demographics | Rating | Rank | Median Household Income |
| Immigrants | Western Europe | 98.8 /100 | #92 | Exceptional $91,936 |
| Immigrants | Lebanon | 98.7 /100 | #93 | Exceptional $91,887 |
| Immigrants | North America | 98.7 /100 | #94 | Exceptional $91,860 |
| Armenians | 98.7 /100 | #95 | Exceptional $91,807 |
| Jordanians | 98.7 /100 | #96 | Exceptional $91,794 |
| Immigrants | Serbia | 98.6 /100 | #97 | Exceptional $91,730 |
| Immigrants | Southern Europe | 98.5 /100 | #98 | Exceptional $91,605 |
| Immigrants | South Eastern Asia | 98.4 /100 | #99 | Exceptional $91,541 |
| Ukrainians | 98.3 /100 | #100 | Exceptional $91,456 |
| Immigrants | Moldova | 98.3 /100 | #101 | Exceptional $91,446 |
| Austrians | 98.2 /100 | #102 | Exceptional $91,339 |
| Immigrants | Ukraine | 98.0 /100 | #103 | Exceptional $91,124 |
| Immigrants | Kazakhstan | 97.8 /100 | #104 | Exceptional $91,015 |
| Immigrants | Brazil | 97.7 /100 | #105 | Exceptional $90,907 |
| Macedonians | 97.4 /100 | #106 | Exceptional $90,761 |
Demographics Similar to Vietnamese by Median Household Income
In terms of median household income, the demographic groups most similar to Vietnamese are Panamanian ($82,272, a difference of 0.030%), Yugoslavian ($82,186, a difference of 0.070%), Nepalese ($82,410, a difference of 0.20%), Venezuelan ($82,432, a difference of 0.22%), and Ecuadorian ($82,070, a difference of 0.22%).
| Demographics | Rating | Rank | Median Household Income |
| French Canadians | 18.7 /100 | #208 | Poor $82,810 |
| Immigrants | Iraq | 16.7 /100 | #209 | Poor $82,594 |
| Immigrants | Uruguay | 16.4 /100 | #210 | Poor $82,560 |
| Salvadorans | 15.4 /100 | #211 | Poor $82,449 |
| Venezuelans | 15.3 /100 | #212 | Poor $82,432 |
| Nepalese | 15.1 /100 | #213 | Poor $82,410 |
| Panamanians | 14.0 /100 | #214 | Poor $82,272 |
| Vietnamese | 13.8 /100 | #215 | Poor $82,248 |
| Yugoslavians | 13.3 /100 | #216 | Poor $82,186 |
| Ecuadorians | 12.5 /100 | #217 | Poor $82,070 |
| Whites/Caucasians | 12.2 /100 | #218 | Poor $82,029 |
| Nigerians | 10.3 /100 | #219 | Poor $81,725 |
| Immigrants | Venezuela | 9.0 /100 | #220 | Tragic $81,506 |
| Immigrants | Ghana | 9.0 /100 | #221 | Tragic $81,489 |
| Immigrants | Nigeria | 7.7 /100 | #222 | Tragic $81,236 |