Immigrants from Singapore vs Vietnamese Median Household Income
COMPARE
Immigrants from Singapore
Vietnamese
Median Household Income
Median Household Income Comparison
Immigrants from Singapore
Vietnamese
$110,428
MEDIAN HOUSEHOLD INCOME
100.0/ 100
METRIC RATING
6th/ 347
METRIC RANK
$82,248
MEDIAN HOUSEHOLD INCOME
13.8/ 100
METRIC RATING
215th/ 347
METRIC RANK
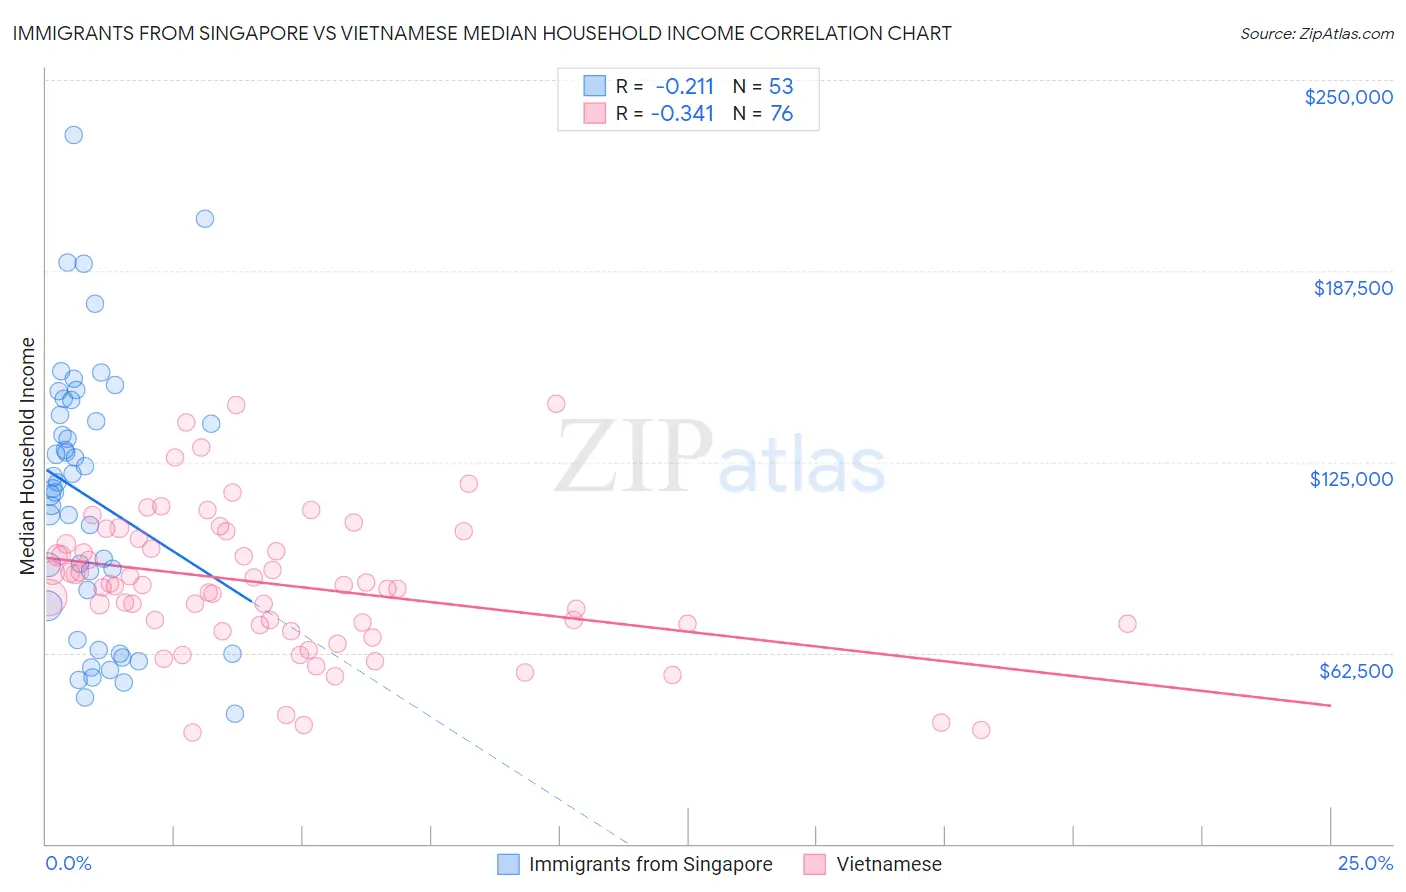
Immigrants from Singapore vs Vietnamese Median Household Income Correlation Chart
The statistical analysis conducted on geographies consisting of 137,415,639 people shows a weak negative correlation between the proportion of Immigrants from Singapore and median household income in the United States with a correlation coefficient (R) of -0.211 and weighted average of $110,428. Similarly, the statistical analysis conducted on geographies consisting of 170,624,806 people shows a mild negative correlation between the proportion of Vietnamese and median household income in the United States with a correlation coefficient (R) of -0.341 and weighted average of $82,248, a difference of 34.3%.
Median Household Income Correlation Summary
| Measurement | Immigrants from Singapore | Vietnamese |
| Minimum | $42,500 | $36,578 |
| Maximum | $232,046 | $143,859 |
| Range | $189,546 | $107,281 |
| Mean | $113,253 | $84,974 |
| Median | $116,276 | $84,533 |
| Interquartile 25% (IQ1) | $72,208 | $71,810 |
| Interquartile 75% (IQ3) | $142,877 | $98,943 |
| Interquartile Range (IQR) | $70,669 | $27,134 |
| Standard Deviation (Sample) | $43,740 | $23,335 |
| Standard Deviation (Population) | $43,325 | $23,181 |
Similar Demographics by Median Household Income
Demographics Similar to Immigrants from Singapore by Median Household Income
In terms of median household income, the demographic groups most similar to Immigrants from Singapore are Thai ($110,648, a difference of 0.20%), Iranian ($109,835, a difference of 0.54%), Immigrants from Hong Kong ($111,519, a difference of 0.99%), Immigrants from Iran ($108,055, a difference of 2.2%), and Immigrants from India ($113,009, a difference of 2.3%).
| Demographics | Rating | Rank | Median Household Income |
| Immigrants | Taiwan | 100.0 /100 | #1 | Exceptional $116,460 |
| Filipinos | 100.0 /100 | #2 | Exceptional $115,509 |
| Immigrants | India | 100.0 /100 | #3 | Exceptional $113,009 |
| Immigrants | Hong Kong | 100.0 /100 | #4 | Exceptional $111,519 |
| Thais | 100.0 /100 | #5 | Exceptional $110,648 |
| Immigrants | Singapore | 100.0 /100 | #6 | Exceptional $110,428 |
| Iranians | 100.0 /100 | #7 | Exceptional $109,835 |
| Immigrants | Iran | 100.0 /100 | #8 | Exceptional $108,055 |
| Okinawans | 100.0 /100 | #9 | Exceptional $106,624 |
| Immigrants | South Central Asia | 100.0 /100 | #10 | Exceptional $106,057 |
| Immigrants | China | 100.0 /100 | #11 | Exceptional $105,335 |
| Indians (Asian) | 100.0 /100 | #12 | Exceptional $105,262 |
| Immigrants | Eastern Asia | 100.0 /100 | #13 | Exceptional $104,796 |
| Immigrants | Ireland | 100.0 /100 | #14 | Exceptional $104,692 |
| Immigrants | Israel | 100.0 /100 | #15 | Exceptional $104,090 |
Demographics Similar to Vietnamese by Median Household Income
In terms of median household income, the demographic groups most similar to Vietnamese are Panamanian ($82,272, a difference of 0.030%), Yugoslavian ($82,186, a difference of 0.070%), Nepalese ($82,410, a difference of 0.20%), Venezuelan ($82,432, a difference of 0.22%), and Ecuadorian ($82,070, a difference of 0.22%).
| Demographics | Rating | Rank | Median Household Income |
| French Canadians | 18.7 /100 | #208 | Poor $82,810 |
| Immigrants | Iraq | 16.7 /100 | #209 | Poor $82,594 |
| Immigrants | Uruguay | 16.4 /100 | #210 | Poor $82,560 |
| Salvadorans | 15.4 /100 | #211 | Poor $82,449 |
| Venezuelans | 15.3 /100 | #212 | Poor $82,432 |
| Nepalese | 15.1 /100 | #213 | Poor $82,410 |
| Panamanians | 14.0 /100 | #214 | Poor $82,272 |
| Vietnamese | 13.8 /100 | #215 | Poor $82,248 |
| Yugoslavians | 13.3 /100 | #216 | Poor $82,186 |
| Ecuadorians | 12.5 /100 | #217 | Poor $82,070 |
| Whites/Caucasians | 12.2 /100 | #218 | Poor $82,029 |
| Nigerians | 10.3 /100 | #219 | Poor $81,725 |
| Immigrants | Venezuela | 9.0 /100 | #220 | Tragic $81,506 |
| Immigrants | Ghana | 9.0 /100 | #221 | Tragic $81,489 |
| Immigrants | Nigeria | 7.7 /100 | #222 | Tragic $81,236 |