Immigrants from South Eastern Asia vs Colville Median Male Earnings
COMPARE
Immigrants from South Eastern Asia
Colville
Median Male Earnings
Median Male Earnings Comparison
Immigrants from South Eastern Asia
Colville
$55,241
MEDIAN MALE EARNINGS
67.6/ 100
METRIC RATING
164th/ 347
METRIC RANK
$48,516
MEDIAN MALE EARNINGS
0.3/ 100
METRIC RATING
274th/ 347
METRIC RANK
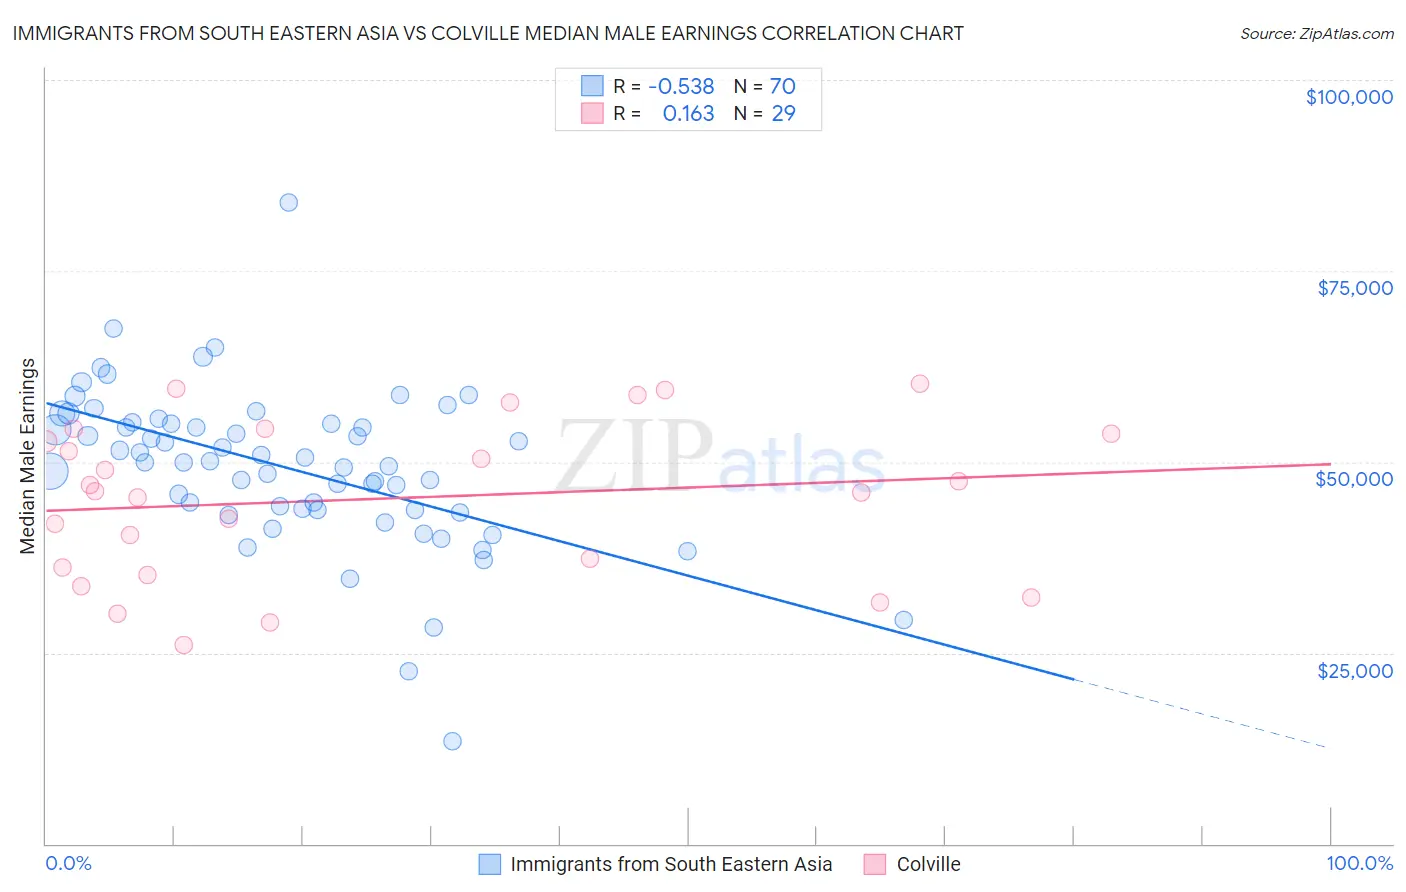
Immigrants from South Eastern Asia vs Colville Median Male Earnings Correlation Chart
The statistical analysis conducted on geographies consisting of 512,315,694 people shows a substantial negative correlation between the proportion of Immigrants from South Eastern Asia and median male earnings in the United States with a correlation coefficient (R) of -0.538 and weighted average of $55,241. Similarly, the statistical analysis conducted on geographies consisting of 34,680,141 people shows a poor positive correlation between the proportion of Colville and median male earnings in the United States with a correlation coefficient (R) of 0.163 and weighted average of $48,516, a difference of 13.9%.
Median Male Earnings Correlation Summary
| Measurement | Immigrants from South Eastern Asia | Colville |
| Minimum | $13,438 | $26,071 |
| Maximum | $83,902 | $60,184 |
| Range | $70,464 | $34,113 |
| Mean | $49,284 | $45,174 |
| Median | $49,995 | $46,167 |
| Interquartile 25% (IQ1) | $43,703 | $35,723 |
| Interquartile 75% (IQ3) | $54,970 | $54,047 |
| Interquartile Range (IQR) | $11,267 | $18,325 |
| Standard Deviation (Sample) | $10,432 | $10,311 |
| Standard Deviation (Population) | $10,357 | $10,132 |
Similar Demographics by Median Male Earnings
Demographics Similar to Immigrants from South Eastern Asia by Median Male Earnings
In terms of median male earnings, the demographic groups most similar to Immigrants from South Eastern Asia are Ugandan ($55,290, a difference of 0.090%), Immigrants from Portugal ($55,182, a difference of 0.11%), French ($55,350, a difference of 0.20%), Belgian ($55,361, a difference of 0.22%), and Basque ($55,370, a difference of 0.23%).
| Demographics | Rating | Rank | Median Male Earnings |
| Icelanders | 71.2 /100 | #157 | Good $55,415 |
| Czechoslovakians | 70.5 /100 | #158 | Good $55,382 |
| Alsatians | 70.5 /100 | #159 | Good $55,380 |
| Basques | 70.3 /100 | #160 | Good $55,370 |
| Belgians | 70.1 /100 | #161 | Good $55,361 |
| French | 69.9 /100 | #162 | Good $55,350 |
| Ugandans | 68.6 /100 | #163 | Good $55,290 |
| Immigrants | South Eastern Asia | 67.6 /100 | #164 | Good $55,241 |
| Immigrants | Portugal | 66.3 /100 | #165 | Good $55,182 |
| Germans | 61.6 /100 | #166 | Good $54,974 |
| Immigrants | Fiji | 61.2 /100 | #167 | Good $54,958 |
| Immigrants | Vietnam | 60.2 /100 | #168 | Good $54,913 |
| French Canadians | 55.6 /100 | #169 | Average $54,722 |
| Finns | 55.6 /100 | #170 | Average $54,721 |
| Immigrants | Peru | 54.9 /100 | #171 | Average $54,695 |
Demographics Similar to Colville by Median Male Earnings
In terms of median male earnings, the demographic groups most similar to Colville are Immigrants from Somalia ($48,439, a difference of 0.16%), Jamaican ($48,632, a difference of 0.24%), Blackfeet ($48,402, a difference of 0.24%), Salvadoran ($48,646, a difference of 0.27%), and Cherokee ($48,669, a difference of 0.32%).
| Demographics | Rating | Rank | Median Male Earnings |
| Spanish Americans | 0.5 /100 | #267 | Tragic $49,008 |
| Ute | 0.4 /100 | #268 | Tragic $48,899 |
| Tsimshian | 0.4 /100 | #269 | Tragic $48,836 |
| Potawatomi | 0.4 /100 | #270 | Tragic $48,768 |
| Cherokee | 0.3 /100 | #271 | Tragic $48,669 |
| Salvadorans | 0.3 /100 | #272 | Tragic $48,646 |
| Jamaicans | 0.3 /100 | #273 | Tragic $48,632 |
| Colville | 0.3 /100 | #274 | Tragic $48,516 |
| Immigrants | Somalia | 0.3 /100 | #275 | Tragic $48,439 |
| Blackfeet | 0.3 /100 | #276 | Tragic $48,402 |
| Belizeans | 0.2 /100 | #277 | Tragic $48,358 |
| Immigrants | Liberia | 0.2 /100 | #278 | Tragic $48,317 |
| Hmong | 0.2 /100 | #279 | Tragic $48,254 |
| Comanche | 0.2 /100 | #280 | Tragic $48,202 |
| Marshallese | 0.2 /100 | #281 | Tragic $48,137 |