Immigrants from Nicaragua vs Colville Median Male Earnings
COMPARE
Immigrants from Nicaragua
Colville
Median Male Earnings
Median Male Earnings Comparison
Immigrants from Nicaragua
Colville
$47,482
MEDIAN MALE EARNINGS
0.1/ 100
METRIC RATING
294th/ 347
METRIC RANK
$48,516
MEDIAN MALE EARNINGS
0.3/ 100
METRIC RATING
274th/ 347
METRIC RANK
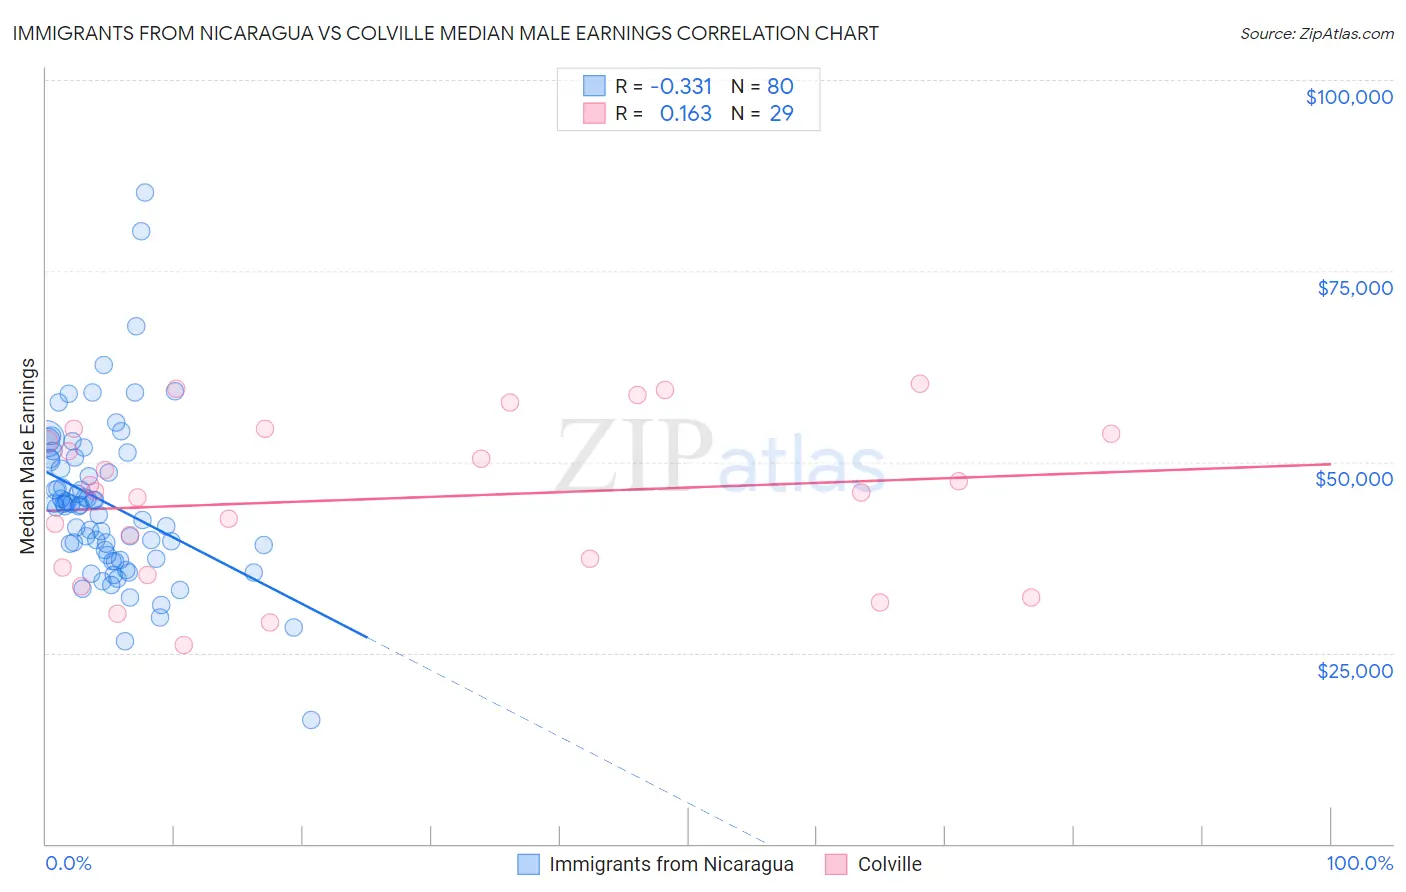
Immigrants from Nicaragua vs Colville Median Male Earnings Correlation Chart
The statistical analysis conducted on geographies consisting of 236,305,617 people shows a mild negative correlation between the proportion of Immigrants from Nicaragua and median male earnings in the United States with a correlation coefficient (R) of -0.331 and weighted average of $47,482. Similarly, the statistical analysis conducted on geographies consisting of 34,680,141 people shows a poor positive correlation between the proportion of Colville and median male earnings in the United States with a correlation coefficient (R) of 0.163 and weighted average of $48,516, a difference of 2.2%.
Median Male Earnings Correlation Summary
| Measurement | Immigrants from Nicaragua | Colville |
| Minimum | $16,250 | $26,071 |
| Maximum | $85,319 | $60,184 |
| Range | $69,069 | $34,113 |
| Mean | $44,541 | $45,174 |
| Median | $44,356 | $46,167 |
| Interquartile 25% (IQ1) | $37,535 | $35,723 |
| Interquartile 75% (IQ3) | $50,283 | $54,047 |
| Interquartile Range (IQR) | $12,748 | $18,325 |
| Standard Deviation (Sample) | $10,745 | $10,311 |
| Standard Deviation (Population) | $10,678 | $10,132 |
Demographics Similar to Immigrants from Nicaragua and Colville by Median Male Earnings
In terms of median male earnings, the demographic groups most similar to Immigrants from Nicaragua are Indonesian ($47,503, a difference of 0.040%), Immigrants from Dominica ($47,651, a difference of 0.36%), Choctaw ($47,729, a difference of 0.52%), Immigrants from Belize ($47,809, a difference of 0.69%), and Chickasaw ($47,832, a difference of 0.74%). Similarly, the demographic groups most similar to Colville are Immigrants from Somalia ($48,439, a difference of 0.16%), Blackfeet ($48,402, a difference of 0.24%), Belizean ($48,358, a difference of 0.33%), Immigrants from Liberia ($48,317, a difference of 0.41%), and Hmong ($48,254, a difference of 0.54%).
| Demographics | Rating | Rank | Median Male Earnings |
| Colville | 0.3 /100 | #274 | Tragic $48,516 |
| Immigrants | Somalia | 0.3 /100 | #275 | Tragic $48,439 |
| Blackfeet | 0.3 /100 | #276 | Tragic $48,402 |
| Belizeans | 0.2 /100 | #277 | Tragic $48,358 |
| Immigrants | Liberia | 0.2 /100 | #278 | Tragic $48,317 |
| Hmong | 0.2 /100 | #279 | Tragic $48,254 |
| Comanche | 0.2 /100 | #280 | Tragic $48,202 |
| Marshallese | 0.2 /100 | #281 | Tragic $48,137 |
| Central Americans | 0.2 /100 | #282 | Tragic $48,093 |
| Immigrants | Jamaica | 0.2 /100 | #283 | Tragic $48,040 |
| Africans | 0.2 /100 | #284 | Tragic $47,994 |
| Paiute | 0.2 /100 | #285 | Tragic $47,991 |
| Mexican American Indians | 0.2 /100 | #286 | Tragic $47,990 |
| Immigrants | El Salvador | 0.2 /100 | #287 | Tragic $47,973 |
| Shoshone | 0.2 /100 | #288 | Tragic $47,930 |
| Chickasaw | 0.1 /100 | #289 | Tragic $47,832 |
| Immigrants | Belize | 0.1 /100 | #290 | Tragic $47,809 |
| Choctaw | 0.1 /100 | #291 | Tragic $47,729 |
| Immigrants | Dominica | 0.1 /100 | #292 | Tragic $47,651 |
| Indonesians | 0.1 /100 | #293 | Tragic $47,503 |
| Immigrants | Nicaragua | 0.1 /100 | #294 | Tragic $47,482 |