Immigrants from South Central Asia vs Immigrants from Lithuania Wage/Income Gap
COMPARE
Immigrants from South Central Asia
Immigrants from Lithuania
Wage/Income Gap
Wage/Income Gap Comparison
Immigrants from South Central Asia
Immigrants from Lithuania
29.3%
WAGE/INCOME GAP
0.0/ 100
METRIC RATING
332nd/ 347
METRIC RANK
28.6%
WAGE/INCOME GAP
0.1/ 100
METRIC RATING
311th/ 347
METRIC RANK
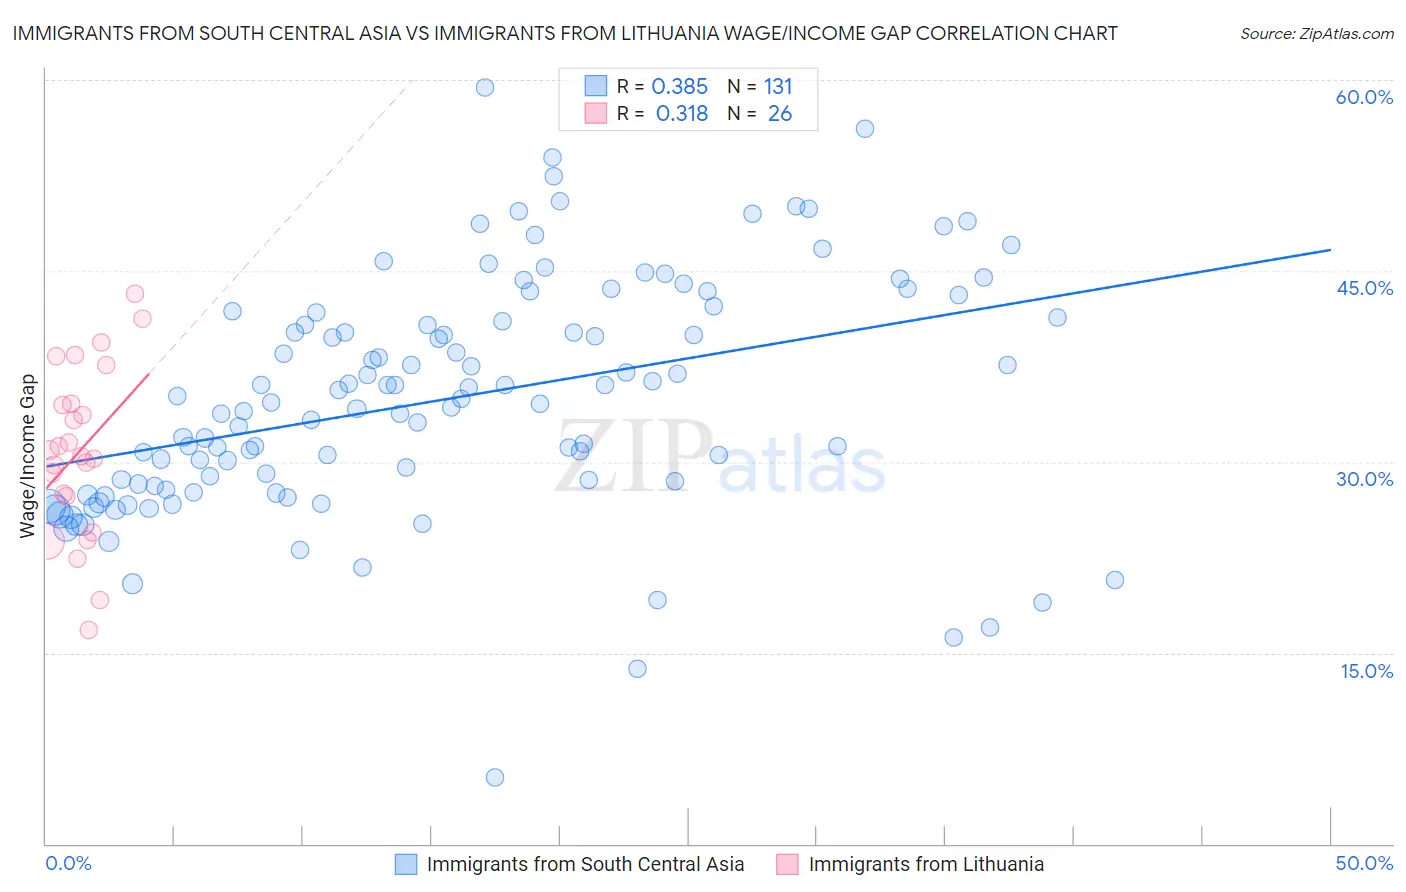
Immigrants from South Central Asia vs Immigrants from Lithuania Wage/Income Gap Correlation Chart
The statistical analysis conducted on geographies consisting of 472,660,484 people shows a mild positive correlation between the proportion of Immigrants from South Central Asia and wage/income gap percentage in the United States with a correlation coefficient (R) of 0.385 and weighted average of 29.3%. Similarly, the statistical analysis conducted on geographies consisting of 117,698,624 people shows a mild positive correlation between the proportion of Immigrants from Lithuania and wage/income gap percentage in the United States with a correlation coefficient (R) of 0.318 and weighted average of 28.6%, a difference of 2.5%.
Wage/Income Gap Correlation Summary
| Measurement | Immigrants from South Central Asia | Immigrants from Lithuania |
| Minimum | 5.2% | 16.8% |
| Maximum | 59.4% | 43.2% |
| Range | 54.2% | 26.5% |
| Mean | 34.9% | 30.9% |
| Median | 34.6% | 30.7% |
| Interquartile 25% (IQ1) | 28.1% | 27.3% |
| Interquartile 75% (IQ3) | 41.3% | 34.5% |
| Interquartile Range (IQR) | 13.2% | 7.3% |
| Standard Deviation (Sample) | 9.3% | 6.7% |
| Standard Deviation (Population) | 9.2% | 6.5% |
Similar Demographics by Wage/Income Gap
Demographics Similar to Immigrants from South Central Asia by Wage/Income Gap
In terms of wage/income gap, the demographic groups most similar to Immigrants from South Central Asia are European (29.4%, a difference of 0.19%), Swedish (29.4%, a difference of 0.34%), Immigrants from Taiwan (29.5%, a difference of 0.46%), English (29.5%, a difference of 0.47%), and Czech (29.2%, a difference of 0.51%).
| Demographics | Rating | Rank | Wage/Income Gap |
| Hungarians | 0.0 /100 | #325 | Tragic 29.0% |
| Immigrants | Belgium | 0.0 /100 | #326 | Tragic 29.0% |
| Immigrants | Iran | 0.0 /100 | #327 | Tragic 29.1% |
| Scandinavians | 0.0 /100 | #328 | Tragic 29.1% |
| Scottish | 0.0 /100 | #329 | Tragic 29.1% |
| Germans | 0.0 /100 | #330 | Tragic 29.2% |
| Czechs | 0.0 /100 | #331 | Tragic 29.2% |
| Immigrants | South Central Asia | 0.0 /100 | #332 | Tragic 29.3% |
| Europeans | 0.0 /100 | #333 | Tragic 29.4% |
| Swedes | 0.0 /100 | #334 | Tragic 29.4% |
| Immigrants | Taiwan | 0.0 /100 | #335 | Tragic 29.5% |
| English | 0.0 /100 | #336 | Tragic 29.5% |
| Dutch | 0.0 /100 | #337 | Tragic 29.6% |
| Filipinos | 0.0 /100 | #338 | Tragic 29.7% |
| Iranians | 0.0 /100 | #339 | Tragic 29.7% |
Demographics Similar to Immigrants from Lithuania by Wage/Income Gap
In terms of wage/income gap, the demographic groups most similar to Immigrants from Lithuania are Finnish (28.6%, a difference of 0.070%), Eastern European (28.6%, a difference of 0.13%), Macedonian (28.6%, a difference of 0.16%), Polish (28.5%, a difference of 0.25%), and French (28.7%, a difference of 0.26%).
| Demographics | Rating | Rank | Wage/Income Gap |
| Immigrants | Netherlands | 0.2 /100 | #304 | Tragic 28.5% |
| Immigrants | South Africa | 0.1 /100 | #305 | Tragic 28.5% |
| Whites/Caucasians | 0.1 /100 | #306 | Tragic 28.5% |
| Immigrants | Denmark | 0.1 /100 | #307 | Tragic 28.5% |
| Poles | 0.1 /100 | #308 | Tragic 28.5% |
| Macedonians | 0.1 /100 | #309 | Tragic 28.6% |
| Finns | 0.1 /100 | #310 | Tragic 28.6% |
| Immigrants | Lithuania | 0.1 /100 | #311 | Tragic 28.6% |
| Eastern Europeans | 0.1 /100 | #312 | Tragic 28.6% |
| French | 0.1 /100 | #313 | Tragic 28.7% |
| Immigrants | Scotland | 0.1 /100 | #314 | Tragic 28.7% |
| Maltese | 0.1 /100 | #315 | Tragic 28.7% |
| Lithuanians | 0.1 /100 | #316 | Tragic 28.7% |
| Belgians | 0.1 /100 | #317 | Tragic 28.8% |
| Basques | 0.1 /100 | #318 | Tragic 28.8% |