Immigrants from Scotland vs Yup'ik Median Household Income
COMPARE
Immigrants from Scotland
Yup'ik
Median Household Income
Median Household Income Comparison
Immigrants from Scotland
Yup'ik
$94,091
MEDIAN HOUSEHOLD INCOME
99.7/ 100
METRIC RATING
67th/ 347
METRIC RANK
$69,695
MEDIAN HOUSEHOLD INCOME
0.0/ 100
METRIC RATING
324th/ 347
METRIC RANK
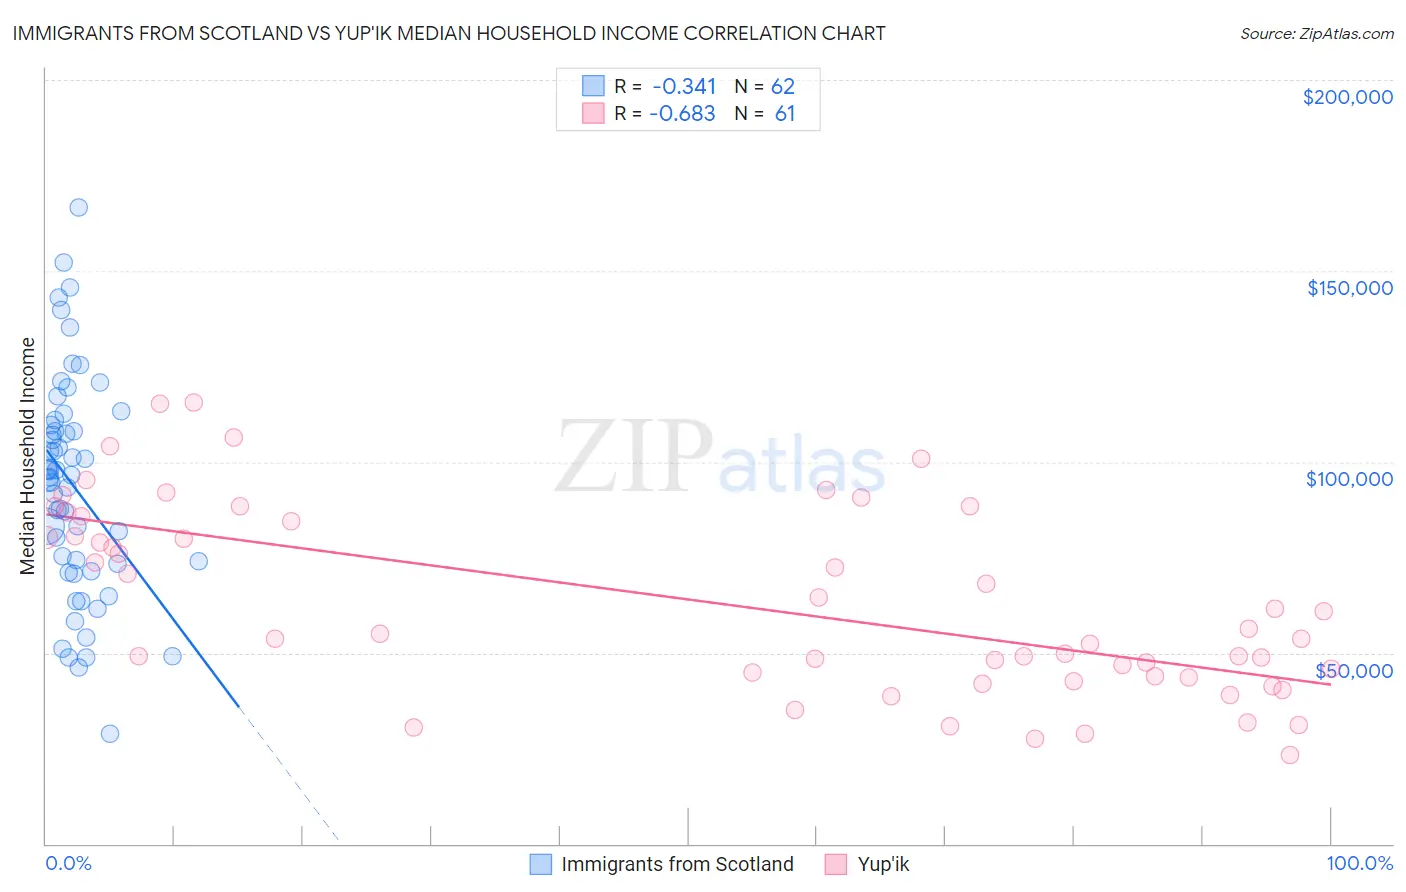
Immigrants from Scotland vs Yup'ik Median Household Income Correlation Chart
The statistical analysis conducted on geographies consisting of 196,370,497 people shows a mild negative correlation between the proportion of Immigrants from Scotland and median household income in the United States with a correlation coefficient (R) of -0.341 and weighted average of $94,091. Similarly, the statistical analysis conducted on geographies consisting of 39,952,449 people shows a significant negative correlation between the proportion of Yup'ik and median household income in the United States with a correlation coefficient (R) of -0.683 and weighted average of $69,695, a difference of 35.0%.
Median Household Income Correlation Summary
| Measurement | Immigrants from Scotland | Yup'ik |
| Minimum | $28,750 | $23,333 |
| Maximum | $166,597 | $115,625 |
| Range | $137,847 | $92,292 |
| Mean | $93,595 | $62,948 |
| Median | $96,232 | $55,000 |
| Interquartile 25% (IQ1) | $73,269 | $43,673 |
| Interquartile 75% (IQ3) | $109,596 | $85,198 |
| Interquartile Range (IQR) | $36,327 | $41,525 |
| Standard Deviation (Sample) | $28,531 | $24,365 |
| Standard Deviation (Population) | $28,300 | $24,165 |
Similar Demographics by Median Household Income
Demographics Similar to Immigrants from Scotland by Median Household Income
In terms of median household income, the demographic groups most similar to Immigrants from Scotland are Mongolian ($93,971, a difference of 0.13%), Immigrants from Romania ($94,222, a difference of 0.14%), Argentinean ($93,960, a difference of 0.14%), Immigrants from Fiji ($93,933, a difference of 0.17%), and Immigrants from Philippines ($93,899, a difference of 0.20%).
| Demographics | Rating | Rank | Median Household Income |
| Koreans | 99.8 /100 | #60 | Exceptional $95,018 |
| Laotians | 99.8 /100 | #61 | Exceptional $94,990 |
| Immigrants | Norway | 99.8 /100 | #62 | Exceptional $94,846 |
| Greeks | 99.8 /100 | #63 | Exceptional $94,735 |
| Immigrants | Netherlands | 99.7 /100 | #64 | Exceptional $94,411 |
| Immigrants | Belarus | 99.7 /100 | #65 | Exceptional $94,399 |
| Immigrants | Romania | 99.7 /100 | #66 | Exceptional $94,222 |
| Immigrants | Scotland | 99.7 /100 | #67 | Exceptional $94,091 |
| Mongolians | 99.7 /100 | #68 | Exceptional $93,971 |
| Argentineans | 99.7 /100 | #69 | Exceptional $93,960 |
| Immigrants | Fiji | 99.7 /100 | #70 | Exceptional $93,933 |
| Immigrants | Philippines | 99.6 /100 | #71 | Exceptional $93,899 |
| Lithuanians | 99.6 /100 | #72 | Exceptional $93,852 |
| Immigrants | Egypt | 99.6 /100 | #73 | Exceptional $93,700 |
| Immigrants | Latvia | 99.6 /100 | #74 | Exceptional $93,602 |
Demographics Similar to Yup'ik by Median Household Income
In terms of median household income, the demographic groups most similar to Yup'ik are Bahamian ($69,726, a difference of 0.040%), Choctaw ($69,947, a difference of 0.36%), Seminole ($69,420, a difference of 0.40%), Chickasaw ($70,005, a difference of 0.45%), and Colville ($70,094, a difference of 0.57%).
| Demographics | Rating | Rank | Median Household Income |
| Cajuns | 0.0 /100 | #317 | Tragic $70,605 |
| Chippewa | 0.0 /100 | #318 | Tragic $70,539 |
| Immigrants | Dominican Republic | 0.0 /100 | #319 | Tragic $70,208 |
| Colville | 0.0 /100 | #320 | Tragic $70,094 |
| Chickasaw | 0.0 /100 | #321 | Tragic $70,005 |
| Choctaw | 0.0 /100 | #322 | Tragic $69,947 |
| Bahamians | 0.0 /100 | #323 | Tragic $69,726 |
| Yup'ik | 0.0 /100 | #324 | Tragic $69,695 |
| Seminole | 0.0 /100 | #325 | Tragic $69,420 |
| Yuman | 0.0 /100 | #326 | Tragic $68,743 |
| Immigrants | Cuba | 0.0 /100 | #327 | Tragic $68,461 |
| Menominee | 0.0 /100 | #328 | Tragic $68,423 |
| Dutch West Indians | 0.0 /100 | #329 | Tragic $68,412 |
| Arapaho | 0.0 /100 | #330 | Tragic $67,965 |
| Natives/Alaskans | 0.0 /100 | #331 | Tragic $67,879 |