Immigrants from Scotland vs Scotch-Irish Median Household Income
COMPARE
Immigrants from Scotland
Scotch-Irish
Median Household Income
Median Household Income Comparison
Immigrants from Scotland
Scotch-Irish
$94,091
MEDIAN HOUSEHOLD INCOME
99.7/ 100
METRIC RATING
67th/ 347
METRIC RANK
$80,972
MEDIAN HOUSEHOLD INCOME
6.6/ 100
METRIC RATING
225th/ 347
METRIC RANK
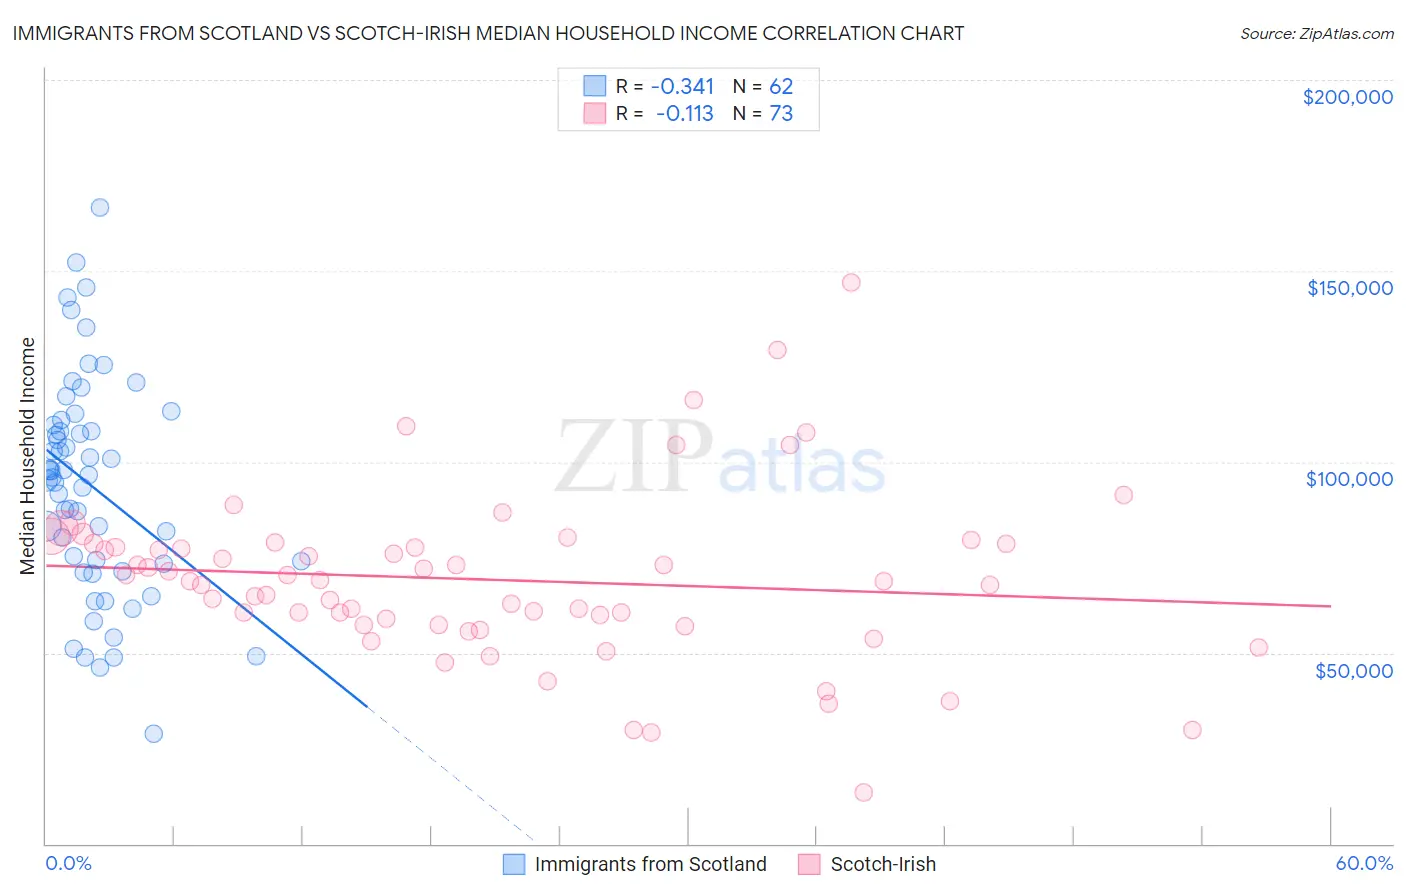
Immigrants from Scotland vs Scotch-Irish Median Household Income Correlation Chart
The statistical analysis conducted on geographies consisting of 196,370,497 people shows a mild negative correlation between the proportion of Immigrants from Scotland and median household income in the United States with a correlation coefficient (R) of -0.341 and weighted average of $94,091. Similarly, the statistical analysis conducted on geographies consisting of 548,026,119 people shows a poor negative correlation between the proportion of Scotch-Irish and median household income in the United States with a correlation coefficient (R) of -0.113 and weighted average of $80,972, a difference of 16.2%.
Median Household Income Correlation Summary
| Measurement | Immigrants from Scotland | Scotch-Irish |
| Minimum | $28,750 | $13,333 |
| Maximum | $166,597 | $146,875 |
| Range | $137,847 | $133,542 |
| Mean | $93,595 | $69,187 |
| Median | $96,232 | $68,778 |
| Interquartile 25% (IQ1) | $73,269 | $57,401 |
| Interquartile 75% (IQ3) | $109,596 | $78,673 |
| Interquartile Range (IQR) | $36,327 | $21,272 |
| Standard Deviation (Sample) | $28,531 | $22,180 |
| Standard Deviation (Population) | $28,300 | $22,027 |
Similar Demographics by Median Household Income
Demographics Similar to Immigrants from Scotland by Median Household Income
In terms of median household income, the demographic groups most similar to Immigrants from Scotland are Mongolian ($93,971, a difference of 0.13%), Immigrants from Romania ($94,222, a difference of 0.14%), Argentinean ($93,960, a difference of 0.14%), Immigrants from Fiji ($93,933, a difference of 0.17%), and Immigrants from Philippines ($93,899, a difference of 0.20%).
| Demographics | Rating | Rank | Median Household Income |
| Koreans | 99.8 /100 | #60 | Exceptional $95,018 |
| Laotians | 99.8 /100 | #61 | Exceptional $94,990 |
| Immigrants | Norway | 99.8 /100 | #62 | Exceptional $94,846 |
| Greeks | 99.8 /100 | #63 | Exceptional $94,735 |
| Immigrants | Netherlands | 99.7 /100 | #64 | Exceptional $94,411 |
| Immigrants | Belarus | 99.7 /100 | #65 | Exceptional $94,399 |
| Immigrants | Romania | 99.7 /100 | #66 | Exceptional $94,222 |
| Immigrants | Scotland | 99.7 /100 | #67 | Exceptional $94,091 |
| Mongolians | 99.7 /100 | #68 | Exceptional $93,971 |
| Argentineans | 99.7 /100 | #69 | Exceptional $93,960 |
| Immigrants | Fiji | 99.7 /100 | #70 | Exceptional $93,933 |
| Immigrants | Philippines | 99.6 /100 | #71 | Exceptional $93,899 |
| Lithuanians | 99.6 /100 | #72 | Exceptional $93,852 |
| Immigrants | Egypt | 99.6 /100 | #73 | Exceptional $93,700 |
| Immigrants | Latvia | 99.6 /100 | #74 | Exceptional $93,602 |
Demographics Similar to Scotch-Irish by Median Household Income
In terms of median household income, the demographic groups most similar to Scotch-Irish are Malaysian ($81,064, a difference of 0.11%), Immigrants from Panama ($80,873, a difference of 0.12%), Guyanese ($80,734, a difference of 0.29%), Immigrants from El Salvador ($81,213, a difference of 0.30%), and Immigrants from Bangladesh ($80,722, a difference of 0.31%).
| Demographics | Rating | Rank | Median Household Income |
| Whites/Caucasians | 12.2 /100 | #218 | Poor $82,029 |
| Nigerians | 10.3 /100 | #219 | Poor $81,725 |
| Immigrants | Venezuela | 9.0 /100 | #220 | Tragic $81,506 |
| Immigrants | Ghana | 9.0 /100 | #221 | Tragic $81,489 |
| Immigrants | Nigeria | 7.7 /100 | #222 | Tragic $81,236 |
| Immigrants | El Salvador | 7.6 /100 | #223 | Tragic $81,213 |
| Malaysians | 7.0 /100 | #224 | Tragic $81,064 |
| Scotch-Irish | 6.6 /100 | #225 | Tragic $80,972 |
| Immigrants | Panama | 6.2 /100 | #226 | Tragic $80,873 |
| Guyanese | 5.7 /100 | #227 | Tragic $80,734 |
| Immigrants | Bangladesh | 5.7 /100 | #228 | Tragic $80,722 |
| Delaware | 5.0 /100 | #229 | Tragic $80,527 |
| Bermudans | 4.7 /100 | #230 | Tragic $80,406 |
| Trinidadians and Tobagonians | 4.7 /100 | #231 | Tragic $80,402 |
| Immigrants | Trinidad and Tobago | 4.6 /100 | #232 | Tragic $80,373 |