Immigrants from Portugal vs Immigrants from Peru Householder Income Ages 25 - 44 years
COMPARE
Immigrants from Portugal
Immigrants from Peru
Householder Income Ages 25 - 44 years
Householder Income Ages 25 - 44 years Comparison
Immigrants from Portugal
Immigrants from Peru
$95,512
HOUSEHOLDER INCOME AGES 25 - 44 YEARS
62.8/ 100
METRIC RATING
161st/ 347
METRIC RANK
$97,329
HOUSEHOLDER INCOME AGES 25 - 44 YEARS
82.2/ 100
METRIC RATING
139th/ 347
METRIC RANK
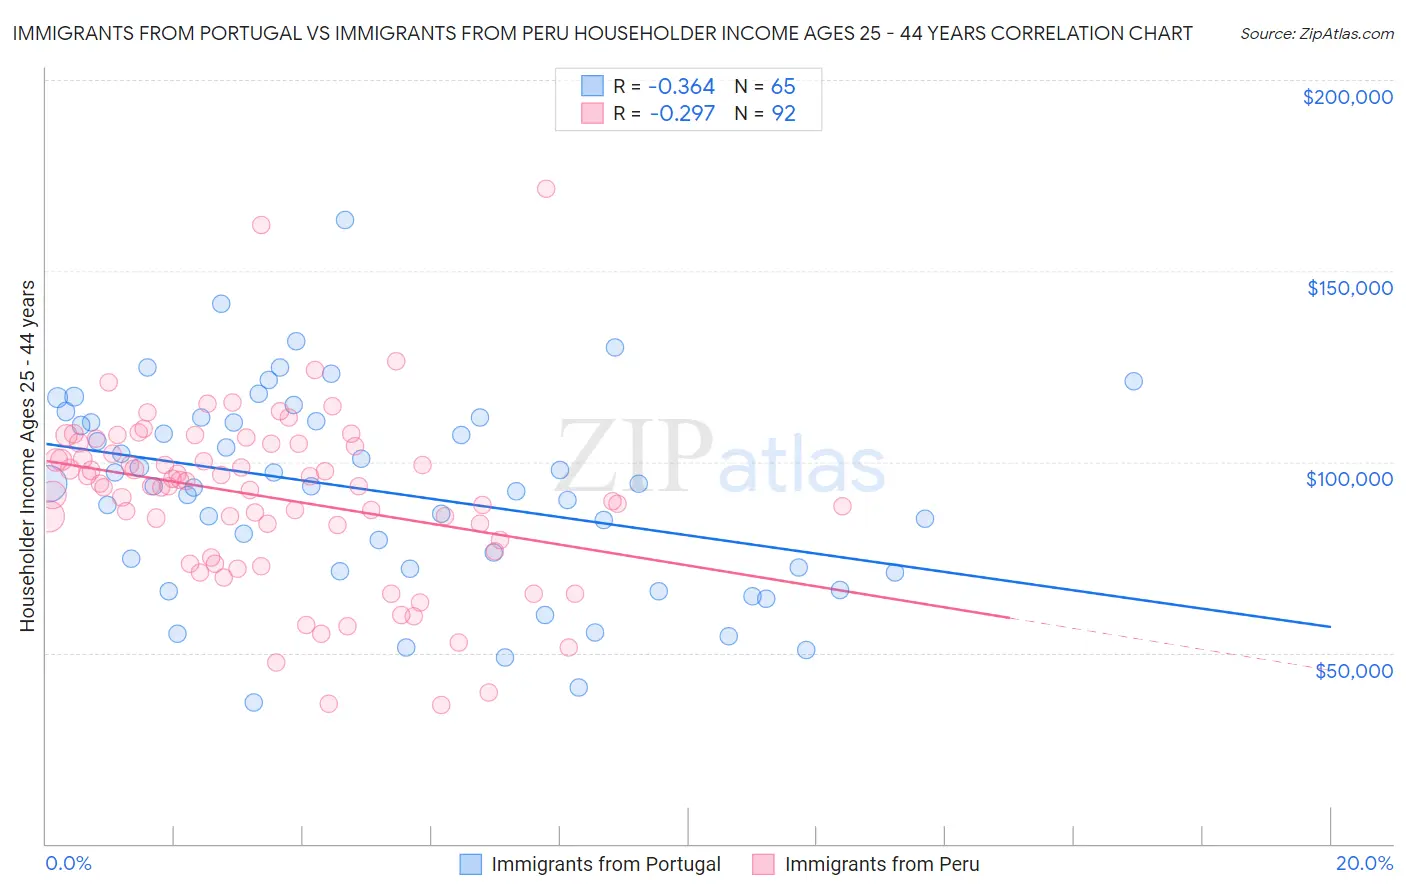
Immigrants from Portugal vs Immigrants from Peru Householder Income Ages 25 - 44 years Correlation Chart
The statistical analysis conducted on geographies consisting of 174,576,361 people shows a mild negative correlation between the proportion of Immigrants from Portugal and household income with householder between the ages 25 and 44 in the United States with a correlation coefficient (R) of -0.364 and weighted average of $95,512. Similarly, the statistical analysis conducted on geographies consisting of 328,285,431 people shows a weak negative correlation between the proportion of Immigrants from Peru and household income with householder between the ages 25 and 44 in the United States with a correlation coefficient (R) of -0.297 and weighted average of $97,329, a difference of 1.9%.
Householder Income Ages 25 - 44 years Correlation Summary
| Measurement | Immigrants from Portugal | Immigrants from Peru |
| Minimum | $36,913 | $36,176 |
| Maximum | $163,387 | $171,373 |
| Range | $126,474 | $135,197 |
| Mean | $92,248 | $90,702 |
| Median | $93,647 | $93,723 |
| Interquartile 25% (IQ1) | $71,683 | $77,980 |
| Interquartile 75% (IQ3) | $111,037 | $104,309 |
| Interquartile Range (IQR) | $39,354 | $26,329 |
| Standard Deviation (Sample) | $26,108 | $22,743 |
| Standard Deviation (Population) | $25,907 | $22,619 |
Similar Demographics by Householder Income Ages 25 - 44 years
Demographics Similar to Immigrants from Portugal by Householder Income Ages 25 - 44 years
In terms of householder income ages 25 - 44 years, the demographic groups most similar to Immigrants from Portugal are Swiss ($95,511, a difference of 0.0%), Icelander ($95,560, a difference of 0.050%), Costa Rican ($95,565, a difference of 0.060%), Immigrants from Saudi Arabia ($95,450, a difference of 0.070%), and Scandinavian ($95,596, a difference of 0.090%).
| Demographics | Rating | Rank | Householder Income Ages 25 - 44 years |
| Slavs | 73.2 /100 | #154 | Good $96,377 |
| Moroccans | 70.3 /100 | #155 | Good $96,117 |
| Immigrants | Germany | 67.9 /100 | #156 | Good $95,913 |
| Immigrants | Uganda | 65.2 /100 | #157 | Good $95,698 |
| Scandinavians | 63.9 /100 | #158 | Good $95,596 |
| Costa Ricans | 63.5 /100 | #159 | Good $95,565 |
| Icelanders | 63.4 /100 | #160 | Good $95,560 |
| Immigrants | Portugal | 62.8 /100 | #161 | Good $95,512 |
| Swiss | 62.8 /100 | #162 | Good $95,511 |
| Immigrants | Saudi Arabia | 62.0 /100 | #163 | Good $95,450 |
| South Americans | 60.9 /100 | #164 | Good $95,362 |
| Immigrants | Nepal | 60.3 /100 | #165 | Good $95,322 |
| Immigrants | Ethiopia | 59.5 /100 | #166 | Average $95,256 |
| Czechoslovakians | 57.0 /100 | #167 | Average $95,070 |
| Alsatians | 56.8 /100 | #168 | Average $95,059 |
Demographics Similar to Immigrants from Peru by Householder Income Ages 25 - 44 years
In terms of householder income ages 25 - 44 years, the demographic groups most similar to Immigrants from Peru are Lebanese ($97,339, a difference of 0.010%), Arab ($97,336, a difference of 0.010%), Immigrants from Morocco ($97,305, a difference of 0.020%), Luxembourger ($97,237, a difference of 0.090%), and Danish ($97,221, a difference of 0.11%).
| Demographics | Rating | Rank | Householder Income Ages 25 - 44 years |
| Immigrants | Zimbabwe | 86.3 /100 | #132 | Excellent $97,880 |
| Tsimshian | 85.8 /100 | #133 | Excellent $97,809 |
| Canadians | 84.5 /100 | #134 | Excellent $97,625 |
| Immigrants | Oceania | 84.5 /100 | #135 | Excellent $97,623 |
| Hungarians | 83.9 /100 | #136 | Excellent $97,544 |
| Lebanese | 82.3 /100 | #137 | Excellent $97,339 |
| Arabs | 82.3 /100 | #138 | Excellent $97,336 |
| Immigrants | Peru | 82.2 /100 | #139 | Excellent $97,329 |
| Immigrants | Morocco | 82.0 /100 | #140 | Excellent $97,305 |
| Luxembourgers | 81.5 /100 | #141 | Excellent $97,237 |
| Danes | 81.3 /100 | #142 | Excellent $97,221 |
| Immigrants | Jordan | 81.0 /100 | #143 | Excellent $97,185 |
| Immigrants | Chile | 80.8 /100 | #144 | Excellent $97,159 |
| Norwegians | 78.2 /100 | #145 | Good $96,866 |
| Ethiopians | 77.8 /100 | #146 | Good $96,824 |