Immigrants from Bulgaria vs Immigrants from Peru Householder Income Ages 25 - 44 years
COMPARE
Immigrants from Bulgaria
Immigrants from Peru
Householder Income Ages 25 - 44 years
Householder Income Ages 25 - 44 years Comparison
Immigrants from Bulgaria
Immigrants from Peru
$103,423
HOUSEHOLDER INCOME AGES 25 - 44 YEARS
99.3/ 100
METRIC RATING
78th/ 347
METRIC RANK
$97,329
HOUSEHOLDER INCOME AGES 25 - 44 YEARS
82.2/ 100
METRIC RATING
139th/ 347
METRIC RANK
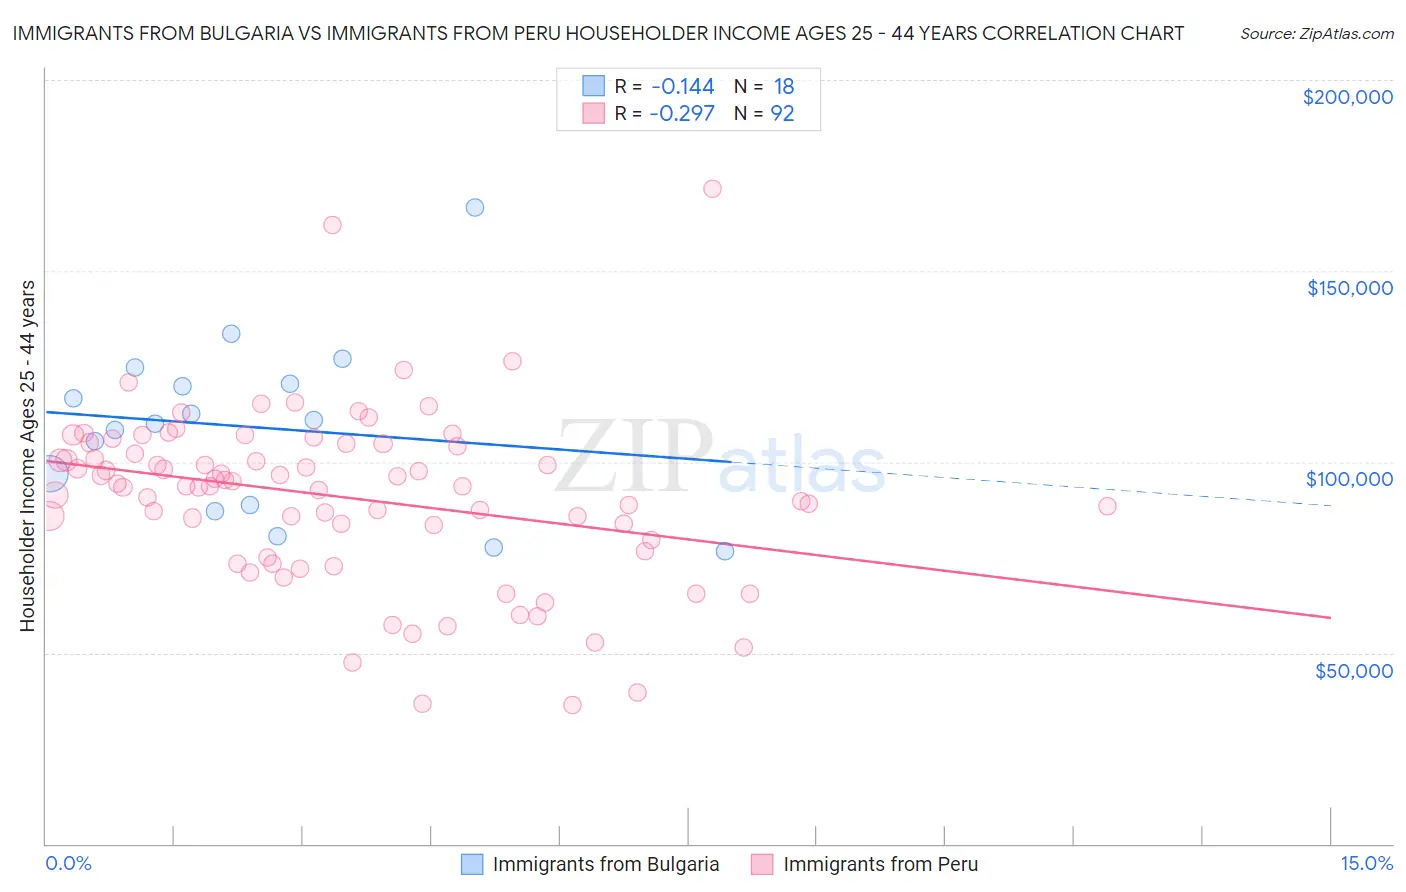
Immigrants from Bulgaria vs Immigrants from Peru Householder Income Ages 25 - 44 years Correlation Chart
The statistical analysis conducted on geographies consisting of 172,413,036 people shows a poor negative correlation between the proportion of Immigrants from Bulgaria and household income with householder between the ages 25 and 44 in the United States with a correlation coefficient (R) of -0.144 and weighted average of $103,423. Similarly, the statistical analysis conducted on geographies consisting of 328,285,431 people shows a weak negative correlation between the proportion of Immigrants from Peru and household income with householder between the ages 25 and 44 in the United States with a correlation coefficient (R) of -0.297 and weighted average of $97,329, a difference of 6.3%.
Householder Income Ages 25 - 44 years Correlation Summary
| Measurement | Immigrants from Bulgaria | Immigrants from Peru |
| Minimum | $76,438 | $36,176 |
| Maximum | $166,675 | $171,373 |
| Range | $90,237 | $135,197 |
| Mean | $109,035 | $90,702 |
| Median | $110,507 | $93,723 |
| Interquartile 25% (IQ1) | $88,575 | $77,980 |
| Interquartile 75% (IQ3) | $120,333 | $104,309 |
| Interquartile Range (IQR) | $31,758 | $26,329 |
| Standard Deviation (Sample) | $22,666 | $22,743 |
| Standard Deviation (Population) | $22,028 | $22,619 |
Similar Demographics by Householder Income Ages 25 - 44 years
Demographics Similar to Immigrants from Bulgaria by Householder Income Ages 25 - 44 years
In terms of householder income ages 25 - 44 years, the demographic groups most similar to Immigrants from Bulgaria are Immigrants from Southern Europe ($103,486, a difference of 0.060%), Armenian ($103,248, a difference of 0.17%), Immigrants from Egypt ($103,192, a difference of 0.22%), South African ($103,160, a difference of 0.25%), and Immigrants from Serbia ($103,155, a difference of 0.26%).
| Demographics | Rating | Rank | Householder Income Ages 25 - 44 years |
| Afghans | 99.6 /100 | #71 | Exceptional $104,410 |
| Chinese | 99.5 /100 | #72 | Exceptional $104,264 |
| Italians | 99.5 /100 | #73 | Exceptional $104,215 |
| Immigrants | Fiji | 99.5 /100 | #74 | Exceptional $103,954 |
| Koreans | 99.4 /100 | #75 | Exceptional $103,824 |
| Immigrants | Spain | 99.4 /100 | #76 | Exceptional $103,752 |
| Immigrants | Southern Europe | 99.3 /100 | #77 | Exceptional $103,486 |
| Immigrants | Bulgaria | 99.3 /100 | #78 | Exceptional $103,423 |
| Armenians | 99.2 /100 | #79 | Exceptional $103,248 |
| Immigrants | Egypt | 99.2 /100 | #80 | Exceptional $103,192 |
| South Africans | 99.2 /100 | #81 | Exceptional $103,160 |
| Immigrants | Serbia | 99.2 /100 | #82 | Exceptional $103,155 |
| Argentineans | 99.1 /100 | #83 | Exceptional $103,111 |
| Immigrants | Philippines | 99.0 /100 | #84 | Exceptional $102,910 |
| Immigrants | Ukraine | 98.9 /100 | #85 | Exceptional $102,664 |
Demographics Similar to Immigrants from Peru by Householder Income Ages 25 - 44 years
In terms of householder income ages 25 - 44 years, the demographic groups most similar to Immigrants from Peru are Lebanese ($97,339, a difference of 0.010%), Arab ($97,336, a difference of 0.010%), Immigrants from Morocco ($97,305, a difference of 0.020%), Luxembourger ($97,237, a difference of 0.090%), and Danish ($97,221, a difference of 0.11%).
| Demographics | Rating | Rank | Householder Income Ages 25 - 44 years |
| Immigrants | Zimbabwe | 86.3 /100 | #132 | Excellent $97,880 |
| Tsimshian | 85.8 /100 | #133 | Excellent $97,809 |
| Canadians | 84.5 /100 | #134 | Excellent $97,625 |
| Immigrants | Oceania | 84.5 /100 | #135 | Excellent $97,623 |
| Hungarians | 83.9 /100 | #136 | Excellent $97,544 |
| Lebanese | 82.3 /100 | #137 | Excellent $97,339 |
| Arabs | 82.3 /100 | #138 | Excellent $97,336 |
| Immigrants | Peru | 82.2 /100 | #139 | Excellent $97,329 |
| Immigrants | Morocco | 82.0 /100 | #140 | Excellent $97,305 |
| Luxembourgers | 81.5 /100 | #141 | Excellent $97,237 |
| Danes | 81.3 /100 | #142 | Excellent $97,221 |
| Immigrants | Jordan | 81.0 /100 | #143 | Excellent $97,185 |
| Immigrants | Chile | 80.8 /100 | #144 | Excellent $97,159 |
| Norwegians | 78.2 /100 | #145 | Good $96,866 |
| Ethiopians | 77.8 /100 | #146 | Good $96,824 |