Immigrants from Poland vs British Median Household Income
COMPARE
Immigrants from Poland
British
Median Household Income
Median Household Income Comparison
Immigrants from Poland
British
$90,549
MEDIAN HOUSEHOLD INCOME
97.1/ 100
METRIC RATING
111th/ 347
METRIC RANK
$88,914
MEDIAN HOUSEHOLD INCOME
92.0/ 100
METRIC RATING
130th/ 347
METRIC RANK
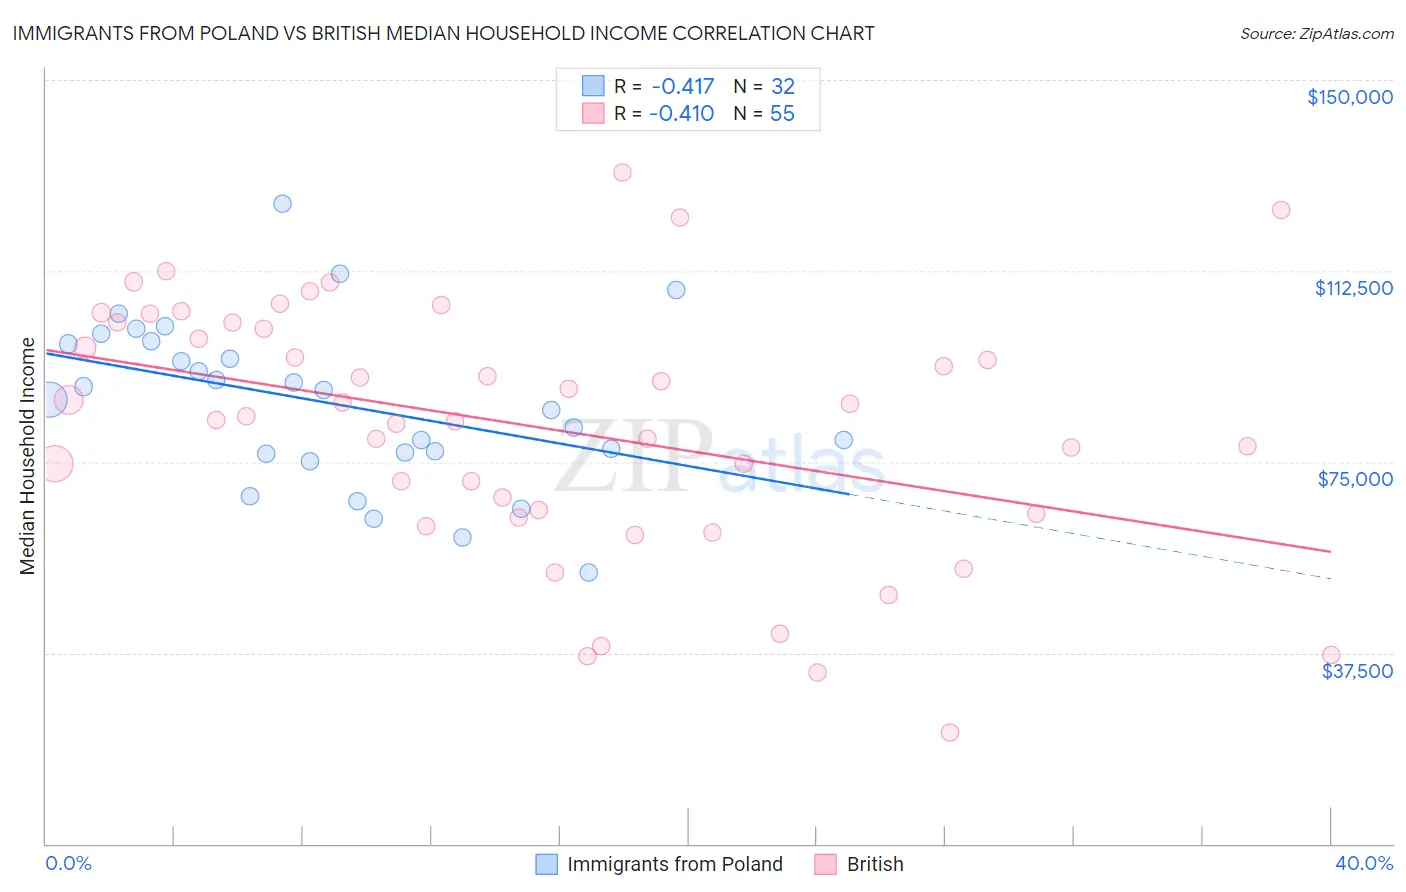
Immigrants from Poland vs British Median Household Income Correlation Chart
The statistical analysis conducted on geographies consisting of 304,762,880 people shows a moderate negative correlation between the proportion of Immigrants from Poland and median household income in the United States with a correlation coefficient (R) of -0.417 and weighted average of $90,549. Similarly, the statistical analysis conducted on geographies consisting of 530,799,157 people shows a moderate negative correlation between the proportion of British and median household income in the United States with a correlation coefficient (R) of -0.410 and weighted average of $88,914, a difference of 1.8%.
Median Household Income Correlation Summary
| Measurement | Immigrants from Poland | British |
| Minimum | $53,329 | $21,968 |
| Maximum | $125,589 | $131,817 |
| Range | $72,260 | $109,849 |
| Mean | $86,504 | $81,960 |
| Median | $88,122 | $83,896 |
| Interquartile 25% (IQ1) | $76,692 | $64,868 |
| Interquartile 75% (IQ3) | $98,535 | $102,423 |
| Interquartile Range (IQR) | $21,843 | $37,555 |
| Standard Deviation (Sample) | $16,261 | $24,875 |
| Standard Deviation (Population) | $16,005 | $24,648 |
Demographics Similar to Immigrants from Poland and British by Median Household Income
In terms of median household income, the demographic groups most similar to Immigrants from Poland are Palestinian ($90,574, a difference of 0.030%), Northern European ($90,446, a difference of 0.11%), Peruvian ($90,261, a difference of 0.32%), Immigrants from Northern Africa ($90,026, a difference of 0.58%), and Immigrants from Western Asia ($90,005, a difference of 0.60%). Similarly, the demographic groups most similar to British are Brazilian ($88,934, a difference of 0.020%), Portuguese ($88,976, a difference of 0.070%), Immigrants from Peru ($89,010, a difference of 0.11%), Immigrants from Oceania ($89,100, a difference of 0.21%), and Immigrants from Kuwait ($89,263, a difference of 0.39%).
| Demographics | Rating | Rank | Median Household Income |
| Palestinians | 97.1 /100 | #110 | Exceptional $90,574 |
| Immigrants | Poland | 97.1 /100 | #111 | Exceptional $90,549 |
| Northern Europeans | 96.9 /100 | #112 | Exceptional $90,446 |
| Peruvians | 96.5 /100 | #113 | Exceptional $90,261 |
| Immigrants | Northern Africa | 95.9 /100 | #114 | Exceptional $90,026 |
| Immigrants | Western Asia | 95.9 /100 | #115 | Exceptional $90,005 |
| Native Hawaiians | 95.7 /100 | #116 | Exceptional $89,919 |
| Taiwanese | 95.6 /100 | #117 | Exceptional $89,900 |
| Syrians | 95.4 /100 | #118 | Exceptional $89,830 |
| Albanians | 95.2 /100 | #119 | Exceptional $89,744 |
| Immigrants | North Macedonia | 95.2 /100 | #120 | Exceptional $89,741 |
| Ethiopians | 94.9 /100 | #121 | Exceptional $89,640 |
| Pakistanis | 94.8 /100 | #122 | Exceptional $89,638 |
| Immigrants | Zimbabwe | 94.4 /100 | #123 | Exceptional $89,496 |
| Immigrants | Jordan | 94.1 /100 | #124 | Exceptional $89,412 |
| Immigrants | Kuwait | 93.5 /100 | #125 | Exceptional $89,263 |
| Immigrants | Oceania | 92.9 /100 | #126 | Exceptional $89,100 |
| Immigrants | Peru | 92.5 /100 | #127 | Exceptional $89,010 |
| Portuguese | 92.3 /100 | #128 | Exceptional $88,976 |
| Brazilians | 92.1 /100 | #129 | Exceptional $88,934 |
| British | 92.0 /100 | #130 | Exceptional $88,914 |