Basque vs British Median Household Income
COMPARE
Basque
British
Median Household Income
Median Household Income Comparison
Basques
British
$87,001
MEDIAN HOUSEHOLD INCOME
77.2/ 100
METRIC RATING
150th/ 347
METRIC RANK
$88,914
MEDIAN HOUSEHOLD INCOME
92.0/ 100
METRIC RATING
130th/ 347
METRIC RANK
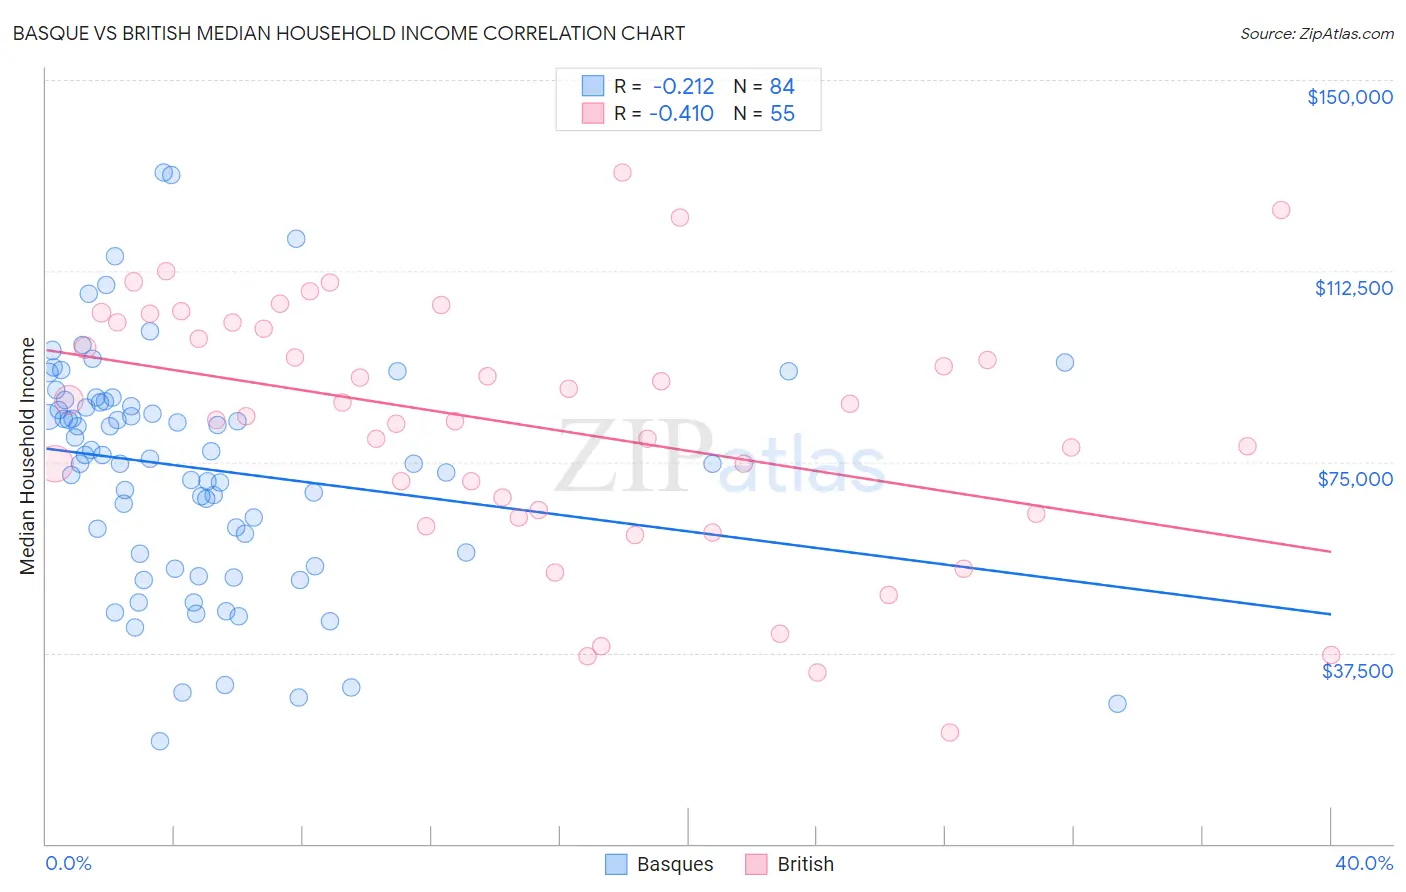
Basque vs British Median Household Income Correlation Chart
The statistical analysis conducted on geographies consisting of 165,746,357 people shows a weak negative correlation between the proportion of Basques and median household income in the United States with a correlation coefficient (R) of -0.212 and weighted average of $87,001. Similarly, the statistical analysis conducted on geographies consisting of 530,799,157 people shows a moderate negative correlation between the proportion of British and median household income in the United States with a correlation coefficient (R) of -0.410 and weighted average of $88,914, a difference of 2.2%.
Median Household Income Correlation Summary
| Measurement | Basque | British |
| Minimum | $20,139 | $21,968 |
| Maximum | $131,838 | $131,817 |
| Range | $111,699 | $109,849 |
| Mean | $73,627 | $81,960 |
| Median | $76,033 | $83,896 |
| Interquartile 25% (IQ1) | $57,079 | $64,868 |
| Interquartile 75% (IQ3) | $86,843 | $102,423 |
| Interquartile Range (IQR) | $29,764 | $37,555 |
| Standard Deviation (Sample) | $22,838 | $24,875 |
| Standard Deviation (Population) | $22,701 | $24,648 |
Demographics Similar to Basques and British by Median Household Income
In terms of median household income, the demographic groups most similar to Basques are Immigrants from Nepal ($87,046, a difference of 0.050%), Costa Rican ($87,262, a difference of 0.30%), South American Indian ($87,446, a difference of 0.51%), Immigrants from Uganda ($87,553, a difference of 0.63%), and Ugandan ($87,557, a difference of 0.64%). Similarly, the demographic groups most similar to British are Immigrants from Syria ($88,792, a difference of 0.14%), European ($88,751, a difference of 0.18%), Immigrants from Ethiopia ($88,687, a difference of 0.26%), Swedish ($88,524, a difference of 0.44%), and Immigrants from Sierra Leone ($88,498, a difference of 0.47%).
| Demographics | Rating | Rank | Median Household Income |
| British | 92.0 /100 | #130 | Exceptional $88,914 |
| Immigrants | Syria | 91.4 /100 | #131 | Exceptional $88,792 |
| Europeans | 91.2 /100 | #132 | Exceptional $88,751 |
| Immigrants | Ethiopia | 90.9 /100 | #133 | Exceptional $88,687 |
| Swedes | 90.0 /100 | #134 | Exceptional $88,524 |
| Immigrants | Sierra Leone | 89.9 /100 | #135 | Excellent $88,498 |
| Poles | 89.7 /100 | #136 | Excellent $88,472 |
| Sierra Leoneans | 89.6 /100 | #137 | Excellent $88,463 |
| Arabs | 89.2 /100 | #138 | Excellent $88,398 |
| Immigrants | Chile | 89.2 /100 | #139 | Excellent $88,388 |
| Lebanese | 87.2 /100 | #140 | Excellent $88,091 |
| Immigrants | Morocco | 86.0 /100 | #141 | Excellent $87,930 |
| Canadians | 84.7 /100 | #142 | Excellent $87,769 |
| Danes | 83.9 /100 | #143 | Excellent $87,676 |
| Serbians | 83.0 /100 | #144 | Excellent $87,572 |
| Ugandans | 82.9 /100 | #145 | Excellent $87,557 |
| Immigrants | Uganda | 82.8 /100 | #146 | Excellent $87,553 |
| South American Indians | 81.8 /100 | #147 | Excellent $87,446 |
| Costa Ricans | 80.0 /100 | #148 | Excellent $87,262 |
| Immigrants | Nepal | 77.7 /100 | #149 | Good $87,046 |
| Basques | 77.2 /100 | #150 | Good $87,001 |