Immigrants from Northern Europe vs Immigrants from North Macedonia Wage/Income Gap
COMPARE
Immigrants from Northern Europe
Immigrants from North Macedonia
Wage/Income Gap
Wage/Income Gap Comparison
Immigrants from Northern Europe
Immigrants from North Macedonia
28.5%
WAGE/INCOME GAP
0.2/ 100
METRIC RATING
300th/ 347
METRIC RANK
28.4%
WAGE/INCOME GAP
0.2/ 100
METRIC RATING
299th/ 347
METRIC RANK
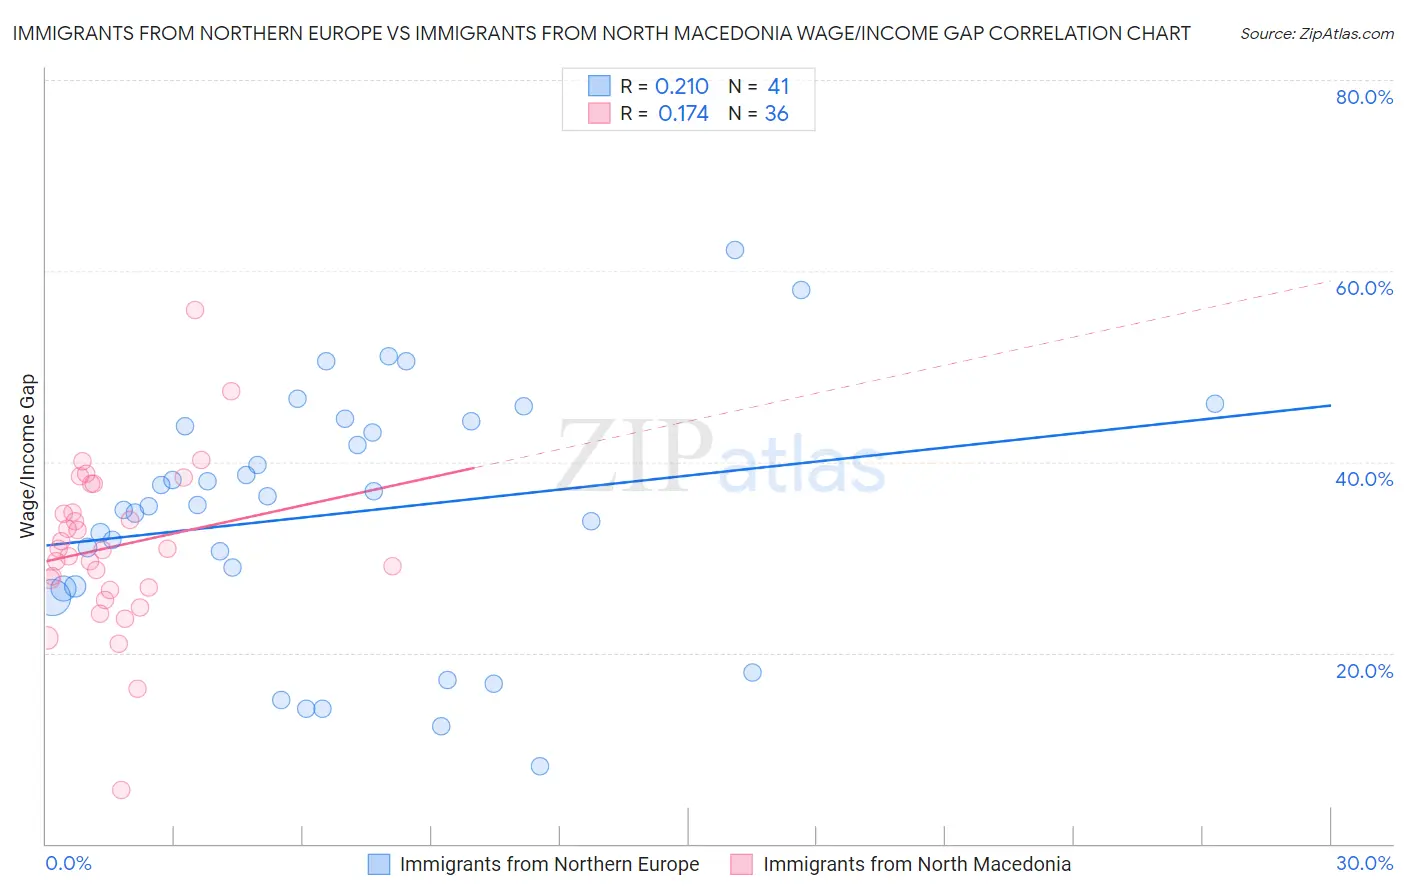
Immigrants from Northern Europe vs Immigrants from North Macedonia Wage/Income Gap Correlation Chart
The statistical analysis conducted on geographies consisting of 476,427,799 people shows a weak positive correlation between the proportion of Immigrants from Northern Europe and wage/income gap percentage in the United States with a correlation coefficient (R) of 0.210 and weighted average of 28.5%. Similarly, the statistical analysis conducted on geographies consisting of 74,314,405 people shows a poor positive correlation between the proportion of Immigrants from North Macedonia and wage/income gap percentage in the United States with a correlation coefficient (R) of 0.174 and weighted average of 28.4%, a difference of 0.12%.
Wage/Income Gap Correlation Summary
| Measurement | Immigrants from Northern Europe | Immigrants from North Macedonia |
| Minimum | 8.1% | 5.6% |
| Maximum | 62.1% | 55.9% |
| Range | 54.0% | 50.3% |
| Mean | 34.6% | 31.1% |
| Median | 35.4% | 30.8% |
| Interquartile 25% (IQ1) | 26.8% | 26.7% |
| Interquartile 75% (IQ3) | 44.0% | 36.2% |
| Interquartile Range (IQR) | 17.2% | 9.4% |
| Standard Deviation (Sample) | 12.8% | 8.7% |
| Standard Deviation (Population) | 12.6% | 8.6% |
Demographics Similar to Immigrants from Northern Europe and Immigrants from North Macedonia by Wage/Income Gap
In terms of wage/income gap, the demographic groups most similar to Immigrants from Northern Europe are Immigrants from Canada (28.5%, a difference of 0.040%), Scotch-Irish (28.5%, a difference of 0.070%), Irish (28.5%, a difference of 0.080%), Austrian (28.4%, a difference of 0.16%), and Immigrants from Netherlands (28.5%, a difference of 0.16%). Similarly, the demographic groups most similar to Immigrants from North Macedonia are Immigrants from North America (28.4%, a difference of 0.050%), Austrian (28.4%, a difference of 0.050%), Immigrants from Canada (28.5%, a difference of 0.16%), Scotch-Irish (28.5%, a difference of 0.19%), and Irish (28.5%, a difference of 0.20%).
| Demographics | Rating | Rank | Wage/Income Gap |
| Canadians | 0.3 /100 | #289 | Tragic 28.1% |
| Australians | 0.3 /100 | #290 | Tragic 28.2% |
| Czechoslovakians | 0.3 /100 | #291 | Tragic 28.2% |
| Immigrants | Australia | 0.3 /100 | #292 | Tragic 28.2% |
| Immigrants | Israel | 0.3 /100 | #293 | Tragic 28.2% |
| Greeks | 0.3 /100 | #294 | Tragic 28.2% |
| Slovenes | 0.3 /100 | #295 | Tragic 28.3% |
| Northern Europeans | 0.3 /100 | #296 | Tragic 28.3% |
| Immigrants | North America | 0.2 /100 | #297 | Tragic 28.4% |
| Austrians | 0.2 /100 | #298 | Tragic 28.4% |
| Immigrants | North Macedonia | 0.2 /100 | #299 | Tragic 28.4% |
| Immigrants | Northern Europe | 0.2 /100 | #300 | Tragic 28.5% |
| Immigrants | Canada | 0.2 /100 | #301 | Tragic 28.5% |
| Scotch-Irish | 0.2 /100 | #302 | Tragic 28.5% |
| Irish | 0.2 /100 | #303 | Tragic 28.5% |
| Immigrants | Netherlands | 0.2 /100 | #304 | Tragic 28.5% |
| Immigrants | South Africa | 0.1 /100 | #305 | Tragic 28.5% |
| Whites/Caucasians | 0.1 /100 | #306 | Tragic 28.5% |
| Immigrants | Denmark | 0.1 /100 | #307 | Tragic 28.5% |
| Poles | 0.1 /100 | #308 | Tragic 28.5% |
| Macedonians | 0.1 /100 | #309 | Tragic 28.6% |