Immigrants from Northern Africa vs Pakistani Householder Income Over 65 years
COMPARE
Immigrants from Northern Africa
Pakistani
Householder Income Over 65 years
Householder Income Over 65 years Comparison
Immigrants from Northern Africa
Pakistanis
$62,522
HOUSEHOLDER INCOME OVER 65 YEARS
83.6/ 100
METRIC RATING
133rd/ 347
METRIC RANK
$63,844
HOUSEHOLDER INCOME OVER 65 YEARS
95.3/ 100
METRIC RATING
107th/ 347
METRIC RANK
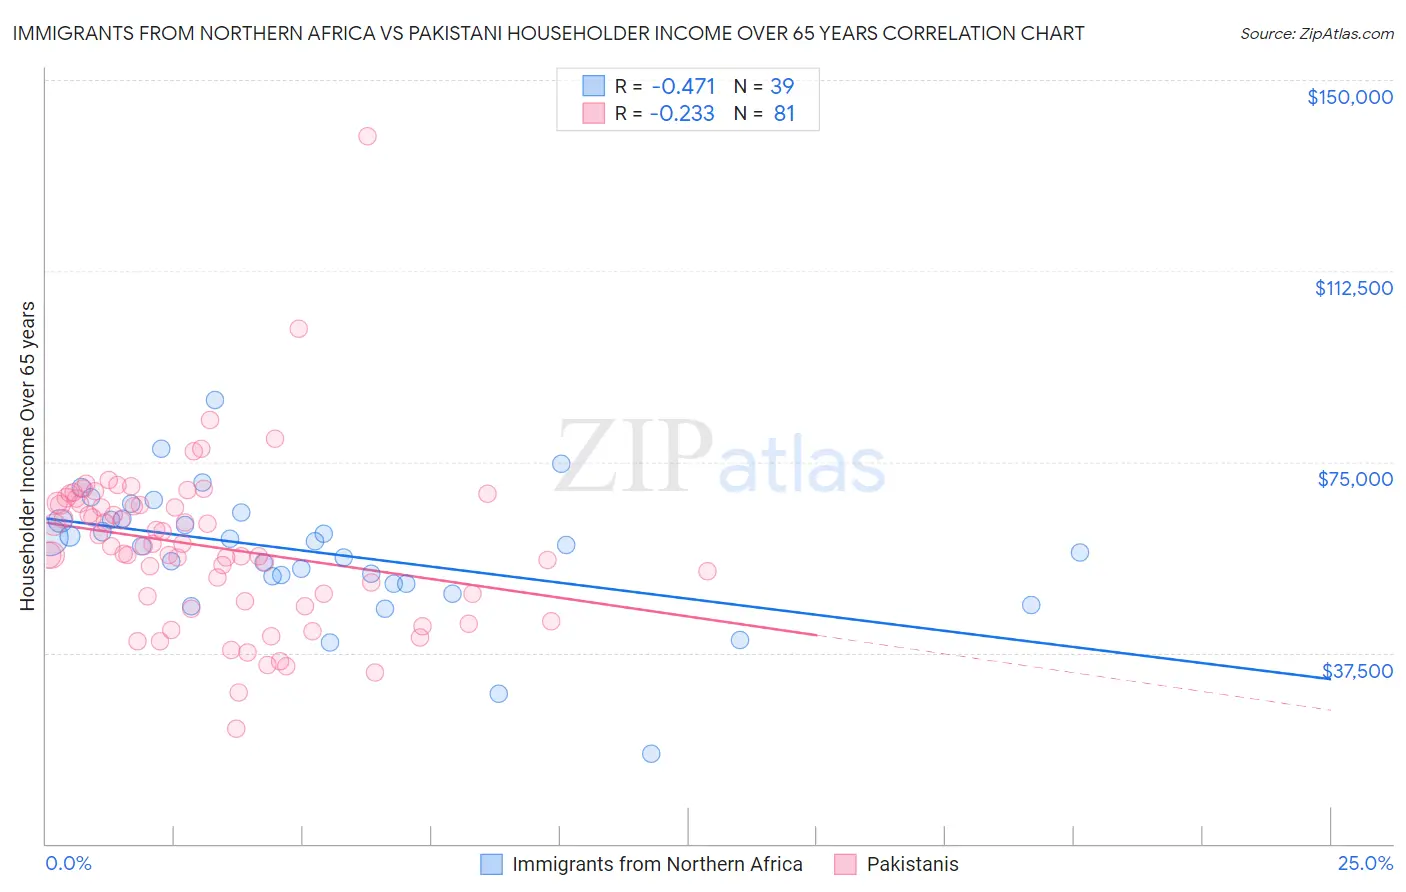
Immigrants from Northern Africa vs Pakistani Householder Income Over 65 years Correlation Chart
The statistical analysis conducted on geographies consisting of 320,603,488 people shows a moderate negative correlation between the proportion of Immigrants from Northern Africa and household income with householder over the age of 65 in the United States with a correlation coefficient (R) of -0.471 and weighted average of $62,522. Similarly, the statistical analysis conducted on geographies consisting of 334,349,406 people shows a weak negative correlation between the proportion of Pakistanis and household income with householder over the age of 65 in the United States with a correlation coefficient (R) of -0.233 and weighted average of $63,844, a difference of 2.1%.
Householder Income Over 65 years Correlation Summary
| Measurement | Immigrants from Northern Africa | Pakistani |
| Minimum | $17,788 | $22,611 |
| Maximum | $87,122 | $139,000 |
| Range | $69,334 | $116,389 |
| Mean | $57,290 | $58,427 |
| Median | $58,750 | $58,443 |
| Interquartile 25% (IQ1) | $51,125 | $48,104 |
| Interquartile 75% (IQ3) | $63,952 | $66,893 |
| Interquartile Range (IQR) | $12,827 | $18,789 |
| Standard Deviation (Sample) | $12,617 | $16,214 |
| Standard Deviation (Population) | $12,454 | $16,114 |
Similar Demographics by Householder Income Over 65 years
Demographics Similar to Immigrants from Northern Africa by Householder Income Over 65 years
In terms of householder income over 65 years, the demographic groups most similar to Immigrants from Northern Africa are Immigrants from Germany ($62,544, a difference of 0.040%), Immigrants from Western Asia ($62,645, a difference of 0.20%), Basque ($62,653, a difference of 0.21%), Immigrants from Brazil ($62,364, a difference of 0.25%), and Immigrants from Eastern Europe ($62,693, a difference of 0.27%).
| Demographics | Rating | Rank | Householder Income Over 65 years |
| Peruvians | 86.8 /100 | #126 | Excellent $62,766 |
| Swedes | 86.4 /100 | #127 | Excellent $62,736 |
| Aleuts | 86.1 /100 | #128 | Excellent $62,708 |
| Immigrants | Eastern Europe | 85.9 /100 | #129 | Excellent $62,693 |
| Basques | 85.4 /100 | #130 | Excellent $62,653 |
| Immigrants | Western Asia | 85.3 /100 | #131 | Excellent $62,645 |
| Immigrants | Germany | 83.9 /100 | #132 | Excellent $62,544 |
| Immigrants | Northern Africa | 83.6 /100 | #133 | Excellent $62,522 |
| Immigrants | Brazil | 81.2 /100 | #134 | Excellent $62,364 |
| Immigrants | Chile | 81.0 /100 | #135 | Excellent $62,354 |
| Alaskan Athabascans | 80.6 /100 | #136 | Excellent $62,330 |
| Immigrants | Syria | 80.2 /100 | #137 | Excellent $62,303 |
| Immigrants | Kazakhstan | 80.0 /100 | #138 | Excellent $62,292 |
| Lebanese | 79.9 /100 | #139 | Good $62,287 |
| Arabs | 79.6 /100 | #140 | Good $62,266 |
Demographics Similar to Pakistanis by Householder Income Over 65 years
In terms of householder income over 65 years, the demographic groups most similar to Pakistanis are Italian ($63,885, a difference of 0.060%), Immigrants from Argentina ($63,885, a difference of 0.060%), Palestinian ($63,800, a difference of 0.070%), Immigrants from Cameroon ($63,907, a difference of 0.10%), and European ($63,779, a difference of 0.10%).
| Demographics | Rating | Rank | Householder Income Over 65 years |
| Immigrants | South Eastern Asia | 96.3 /100 | #100 | Exceptional $64,089 |
| Immigrants | Italy | 96.2 /100 | #101 | Exceptional $64,065 |
| Chileans | 95.8 /100 | #102 | Exceptional $63,957 |
| British | 95.7 /100 | #103 | Exceptional $63,940 |
| Immigrants | Cameroon | 95.6 /100 | #104 | Exceptional $63,907 |
| Italians | 95.5 /100 | #105 | Exceptional $63,885 |
| Immigrants | Argentina | 95.5 /100 | #106 | Exceptional $63,885 |
| Pakistanis | 95.3 /100 | #107 | Exceptional $63,844 |
| Palestinians | 95.1 /100 | #108 | Exceptional $63,800 |
| Europeans | 95.0 /100 | #109 | Exceptional $63,779 |
| Immigrants | Zimbabwe | 94.3 /100 | #110 | Exceptional $63,643 |
| Immigrants | Spain | 93.7 /100 | #111 | Exceptional $63,540 |
| Syrians | 93.4 /100 | #112 | Exceptional $63,494 |
| Immigrants | Serbia | 92.7 /100 | #113 | Exceptional $63,387 |
| Immigrants | Saudi Arabia | 92.4 /100 | #114 | Exceptional $63,355 |