Immigrants from Northern Africa vs Pakistani 1st Grade
COMPARE
Immigrants from Northern Africa
Pakistani
1st Grade
1st Grade Comparison
Immigrants from Northern Africa
Pakistanis
97.8%
1ST GRADE
12.0/ 100
METRIC RATING
208th/ 347
METRIC RANK
97.9%
1ST GRADE
35.8/ 100
METRIC RATING
187th/ 347
METRIC RANK
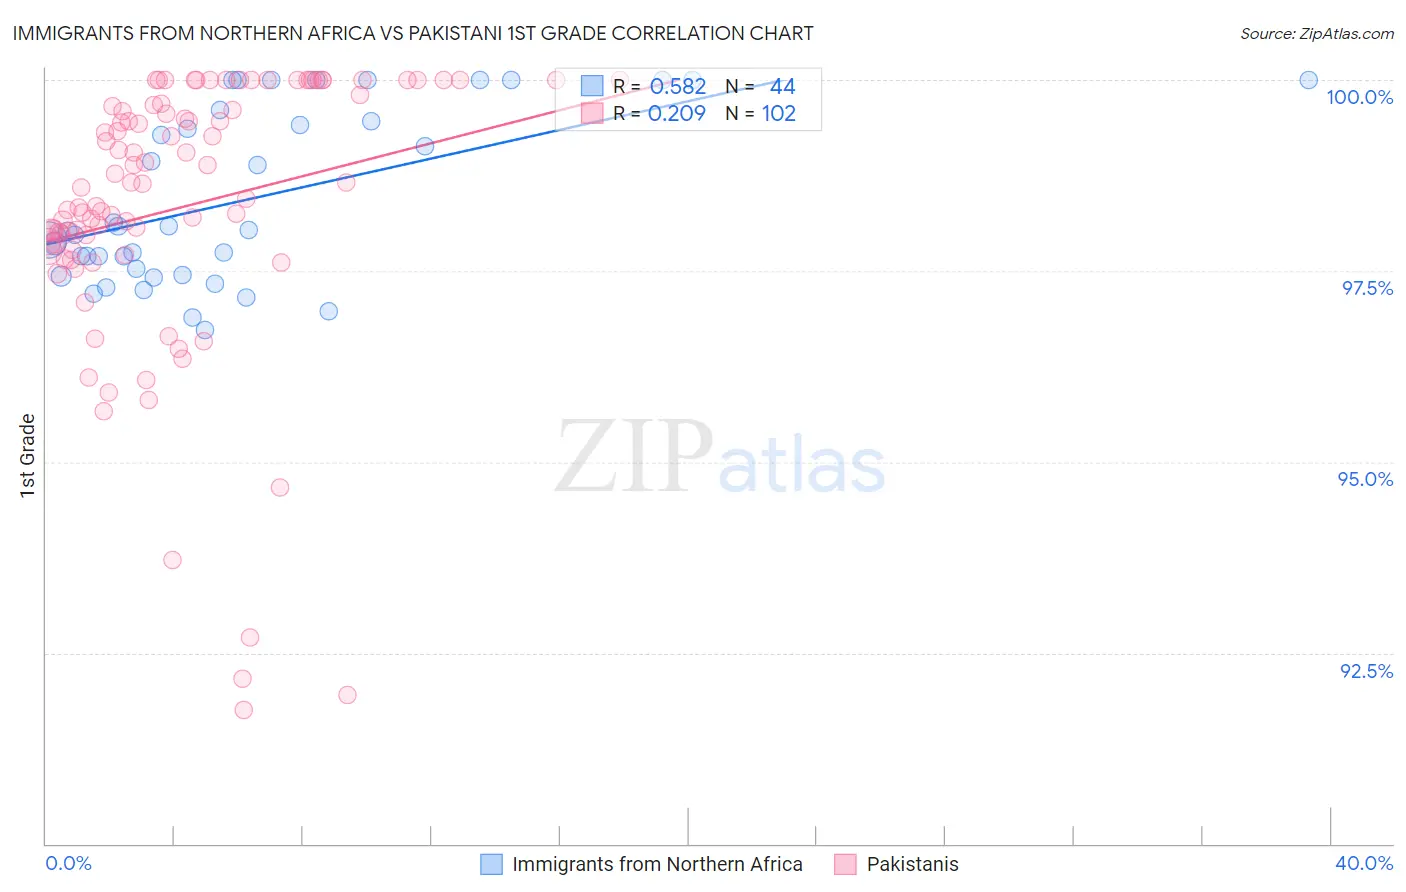
Immigrants from Northern Africa vs Pakistani 1st Grade Correlation Chart
The statistical analysis conducted on geographies consisting of 321,196,768 people shows a substantial positive correlation between the proportion of Immigrants from Northern Africa and percentage of population with at least 1st grade education in the United States with a correlation coefficient (R) of 0.582 and weighted average of 97.8%. Similarly, the statistical analysis conducted on geographies consisting of 335,355,426 people shows a weak positive correlation between the proportion of Pakistanis and percentage of population with at least 1st grade education in the United States with a correlation coefficient (R) of 0.209 and weighted average of 97.9%, a difference of 0.11%.
1st Grade Correlation Summary
| Measurement | Immigrants from Northern Africa | Pakistani |
| Minimum | 96.7% | 91.8% |
| Maximum | 100.0% | 100.0% |
| Range | 3.3% | 8.2% |
| Mean | 98.4% | 98.3% |
| Median | 98.0% | 98.6% |
| Interquartile 25% (IQ1) | 97.5% | 97.8% |
| Interquartile 75% (IQ3) | 99.5% | 99.7% |
| Interquartile Range (IQR) | 2.0% | 1.9% |
| Standard Deviation (Sample) | 1.1% | 1.8% |
| Standard Deviation (Population) | 1.1% | 1.8% |
Similar Demographics by 1st Grade
Demographics Similar to Immigrants from Northern Africa by 1st Grade
In terms of 1st grade, the demographic groups most similar to Immigrants from Northern Africa are Costa Rican (97.8%, a difference of 0.0%), Immigrants from Oceania (97.8%, a difference of 0.010%), Laotian (97.8%, a difference of 0.010%), Immigrants from Albania (97.8%, a difference of 0.030%), and African (97.8%, a difference of 0.030%).
| Demographics | Rating | Rank | 1st Grade |
| Immigrants | Lebanon | 20.1 /100 | #201 | Fair 97.8% |
| Immigrants | Ukraine | 19.2 /100 | #202 | Poor 97.8% |
| Immigrants | Southern Europe | 18.2 /100 | #203 | Poor 97.8% |
| Immigrants | Uganda | 18.2 /100 | #204 | Poor 97.8% |
| Immigrants | Chile | 17.7 /100 | #205 | Poor 97.8% |
| Immigrants | Albania | 17.3 /100 | #206 | Poor 97.8% |
| Africans | 16.5 /100 | #207 | Poor 97.8% |
| Immigrants | Northern Africa | 12.0 /100 | #208 | Poor 97.8% |
| Costa Ricans | 11.6 /100 | #209 | Poor 97.8% |
| Immigrants | Oceania | 11.0 /100 | #210 | Poor 97.8% |
| Laotians | 10.3 /100 | #211 | Poor 97.8% |
| Moroccans | 8.7 /100 | #212 | Tragic 97.7% |
| Immigrants | Bahamas | 8.1 /100 | #213 | Tragic 97.7% |
| South American Indians | 7.6 /100 | #214 | Tragic 97.7% |
| Bahamians | 7.5 /100 | #215 | Tragic 97.7% |
Demographics Similar to Pakistanis by 1st Grade
In terms of 1st grade, the demographic groups most similar to Pakistanis are Paiute (97.9%, a difference of 0.0%), Arab (97.9%, a difference of 0.0%), Immigrants from Kazakhstan (97.9%, a difference of 0.0%), Immigrants from Poland (97.9%, a difference of 0.010%), and Immigrants from Belarus (97.9%, a difference of 0.010%).
| Demographics | Rating | Rank | 1st Grade |
| Immigrants | Bosnia and Herzegovina | 46.6 /100 | #180 | Average 97.9% |
| Portuguese | 44.2 /100 | #181 | Average 97.9% |
| Egyptians | 42.7 /100 | #182 | Average 97.9% |
| Immigrants | Argentina | 41.3 /100 | #183 | Average 97.9% |
| Immigrants | Poland | 40.1 /100 | #184 | Average 97.9% |
| Immigrants | Belarus | 39.3 /100 | #185 | Fair 97.9% |
| Paiute | 36.5 /100 | #186 | Fair 97.9% |
| Pakistanis | 35.8 /100 | #187 | Fair 97.9% |
| Arabs | 35.5 /100 | #188 | Fair 97.9% |
| Immigrants | Kazakhstan | 34.9 /100 | #189 | Fair 97.9% |
| Panamanians | 34.1 /100 | #190 | Fair 97.9% |
| Blacks/African Americans | 30.7 /100 | #191 | Fair 97.9% |
| Paraguayans | 30.2 /100 | #192 | Fair 97.9% |
| Immigrants | Taiwan | 29.4 /100 | #193 | Fair 97.9% |
| Mongolians | 29.2 /100 | #194 | Fair 97.9% |