Immigrants from North Macedonia vs Immigrants from Europe Median Male Earnings
COMPARE
Immigrants from North Macedonia
Immigrants from Europe
Median Male Earnings
Median Male Earnings Comparison
Immigrants from North Macedonia
Immigrants from Europe
$59,189
MEDIAN MALE EARNINGS
99.0/ 100
METRIC RATING
94th/ 347
METRIC RANK
$62,057
MEDIAN MALE EARNINGS
99.9/ 100
METRIC RATING
49th/ 347
METRIC RANK
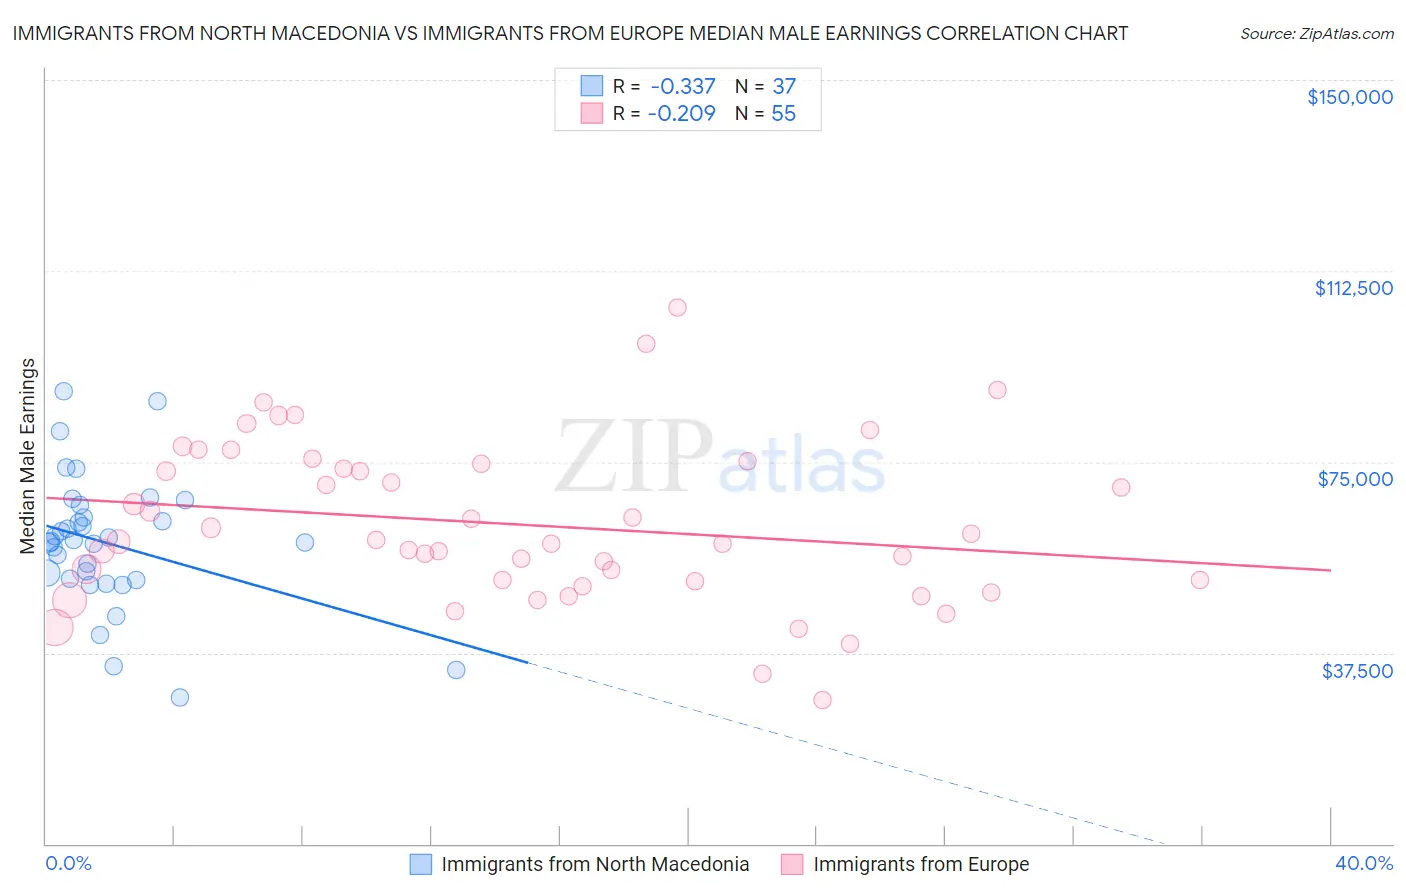
Immigrants from North Macedonia vs Immigrants from Europe Median Male Earnings Correlation Chart
The statistical analysis conducted on geographies consisting of 74,299,298 people shows a mild negative correlation between the proportion of Immigrants from North Macedonia and median male earnings in the United States with a correlation coefficient (R) of -0.337 and weighted average of $59,189. Similarly, the statistical analysis conducted on geographies consisting of 546,673,847 people shows a weak negative correlation between the proportion of Immigrants from Europe and median male earnings in the United States with a correlation coefficient (R) of -0.209 and weighted average of $62,057, a difference of 4.9%.
Median Male Earnings Correlation Summary
| Measurement | Immigrants from North Macedonia | Immigrants from Europe |
| Minimum | $28,661 | $28,125 |
| Maximum | $88,807 | $105,302 |
| Range | $60,146 | $77,177 |
| Mean | $58,993 | $62,740 |
| Median | $59,337 | $59,324 |
| Interquartile 25% (IQ1) | $51,864 | $51,620 |
| Interquartile 75% (IQ3) | $65,296 | $74,675 |
| Interquartile Range (IQR) | $13,432 | $23,055 |
| Standard Deviation (Sample) | $12,888 | $15,923 |
| Standard Deviation (Population) | $12,712 | $15,777 |
Similar Demographics by Median Male Earnings
Demographics Similar to Immigrants from North Macedonia by Median Male Earnings
In terms of median male earnings, the demographic groups most similar to Immigrants from North Macedonia are Immigrants from Southern Europe ($59,217, a difference of 0.050%), Immigrants from Kazakhstan ($59,278, a difference of 0.15%), Laotian ($59,351, a difference of 0.27%), Austrian ($59,359, a difference of 0.29%), and Immigrants from Moldova ($59,417, a difference of 0.39%).
| Demographics | Rating | Rank | Median Male Earnings |
| Macedonians | 99.3 /100 | #87 | Exceptional $59,522 |
| Immigrants | Argentina | 99.3 /100 | #88 | Exceptional $59,491 |
| Immigrants | Moldova | 99.2 /100 | #89 | Exceptional $59,417 |
| Austrians | 99.2 /100 | #90 | Exceptional $59,359 |
| Laotians | 99.2 /100 | #91 | Exceptional $59,351 |
| Immigrants | Kazakhstan | 99.1 /100 | #92 | Exceptional $59,278 |
| Immigrants | Southern Europe | 99.0 /100 | #93 | Exceptional $59,217 |
| Immigrants | North Macedonia | 99.0 /100 | #94 | Exceptional $59,189 |
| Immigrants | Lebanon | 98.6 /100 | #95 | Exceptional $58,835 |
| Albanians | 98.4 /100 | #96 | Exceptional $58,680 |
| Northern Europeans | 98.2 /100 | #97 | Exceptional $58,588 |
| Jordanians | 98.1 /100 | #98 | Exceptional $58,500 |
| Immigrants | Poland | 98.0 /100 | #99 | Exceptional $58,452 |
| Assyrians/Chaldeans/Syriacs | 97.9 /100 | #100 | Exceptional $58,437 |
| Immigrants | Brazil | 97.7 /100 | #101 | Exceptional $58,324 |
Demographics Similar to Immigrants from Europe by Median Male Earnings
In terms of median male earnings, the demographic groups most similar to Immigrants from Europe are Immigrants from Malaysia ($62,121, a difference of 0.10%), Immigrants from Austria ($62,164, a difference of 0.17%), Immigrants from Czechoslovakia ($62,217, a difference of 0.26%), Bhutanese ($61,759, a difference of 0.48%), and Bulgarian ($62,378, a difference of 0.52%).
| Demographics | Rating | Rank | Median Male Earnings |
| Immigrants | Greece | 100.0 /100 | #42 | Exceptional $62,689 |
| Immigrants | Belarus | 100.0 /100 | #43 | Exceptional $62,658 |
| Cambodians | 100.0 /100 | #44 | Exceptional $62,516 |
| Bulgarians | 100.0 /100 | #45 | Exceptional $62,378 |
| Immigrants | Czechoslovakia | 99.9 /100 | #46 | Exceptional $62,217 |
| Immigrants | Austria | 99.9 /100 | #47 | Exceptional $62,164 |
| Immigrants | Malaysia | 99.9 /100 | #48 | Exceptional $62,121 |
| Immigrants | Europe | 99.9 /100 | #49 | Exceptional $62,057 |
| Bhutanese | 99.9 /100 | #50 | Exceptional $61,759 |
| Estonians | 99.9 /100 | #51 | Exceptional $61,710 |
| Immigrants | Norway | 99.9 /100 | #52 | Exceptional $61,628 |
| South Africans | 99.9 /100 | #53 | Exceptional $61,460 |
| Immigrants | Latvia | 99.9 /100 | #54 | Exceptional $61,422 |
| Greeks | 99.9 /100 | #55 | Exceptional $61,242 |
| Lithuanians | 99.9 /100 | #56 | Exceptional $61,228 |