Asian vs Immigrants from Europe Median Male Earnings
COMPARE
Asian
Immigrants from Europe
Median Male Earnings
Median Male Earnings Comparison
Asians
Immigrants from Europe
$63,827
MEDIAN MALE EARNINGS
100.0/ 100
METRIC RATING
29th/ 347
METRIC RANK
$62,057
MEDIAN MALE EARNINGS
99.9/ 100
METRIC RATING
49th/ 347
METRIC RANK
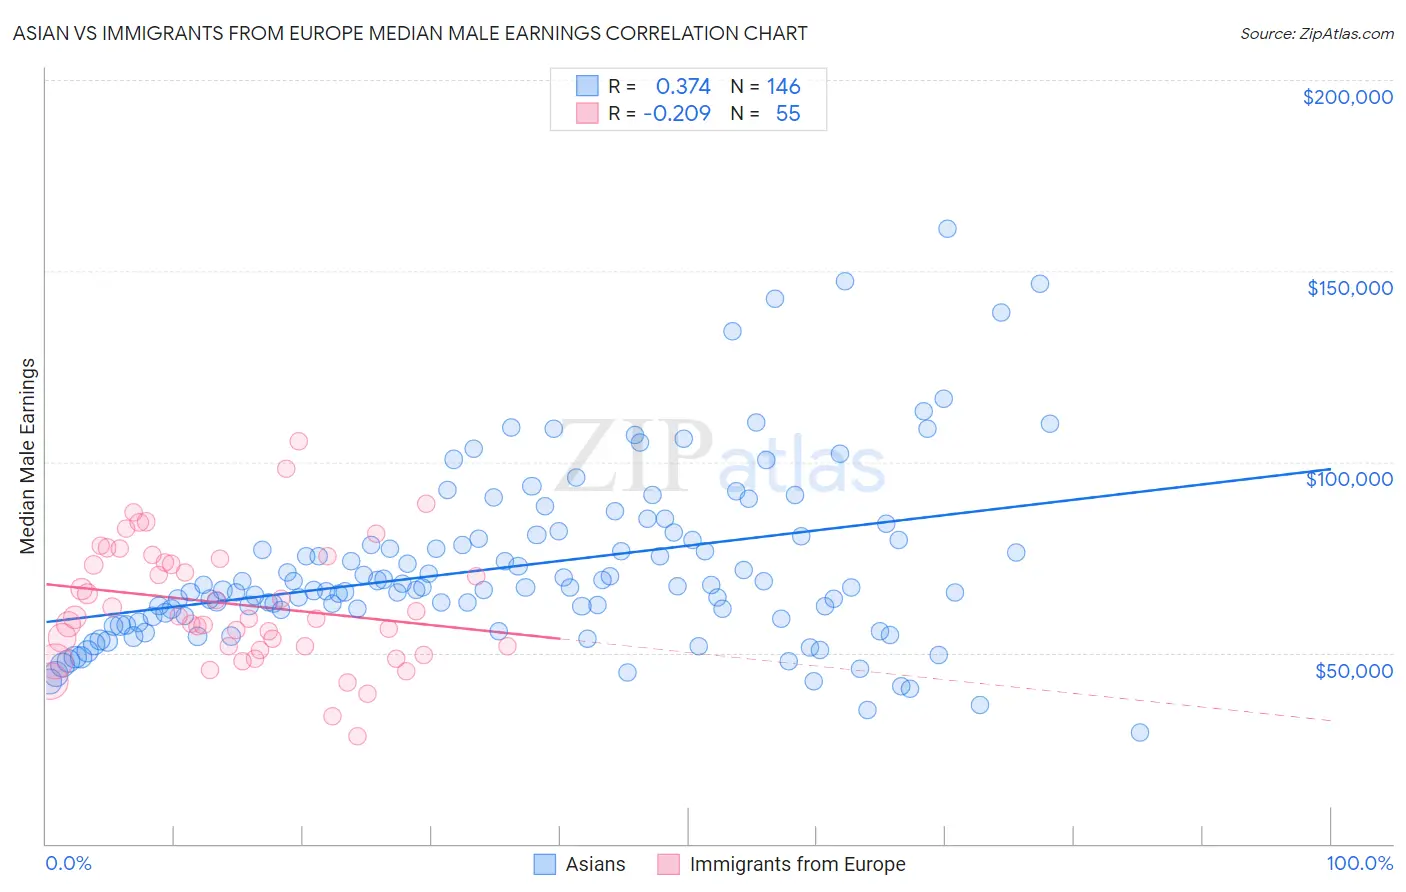
Asian vs Immigrants from Europe Median Male Earnings Correlation Chart
The statistical analysis conducted on geographies consisting of 550,236,506 people shows a mild positive correlation between the proportion of Asians and median male earnings in the United States with a correlation coefficient (R) of 0.374 and weighted average of $63,827. Similarly, the statistical analysis conducted on geographies consisting of 546,673,847 people shows a weak negative correlation between the proportion of Immigrants from Europe and median male earnings in the United States with a correlation coefficient (R) of -0.209 and weighted average of $62,057, a difference of 2.9%.
Median Male Earnings Correlation Summary
| Measurement | Asian | Immigrants from Europe |
| Minimum | $29,236 | $28,125 |
| Maximum | $160,917 | $105,302 |
| Range | $131,681 | $77,177 |
| Mean | $72,799 | $62,740 |
| Median | $67,194 | $59,324 |
| Interquartile 25% (IQ1) | $59,553 | $51,620 |
| Interquartile 75% (IQ3) | $80,527 | $74,675 |
| Interquartile Range (IQR) | $20,975 | $23,055 |
| Standard Deviation (Sample) | $23,189 | $15,923 |
| Standard Deviation (Population) | $23,109 | $15,777 |
Demographics Similar to Asians and Immigrants from Europe by Median Male Earnings
In terms of median male earnings, the demographic groups most similar to Asians are Immigrants from France ($63,715, a difference of 0.18%), Latvian ($63,498, a difference of 0.52%), Soviet Union ($63,382, a difference of 0.70%), Immigrants from Lithuania ($63,346, a difference of 0.76%), and Immigrants from Russia ($63,326, a difference of 0.79%). Similarly, the demographic groups most similar to Immigrants from Europe are Immigrants from Malaysia ($62,121, a difference of 0.10%), Immigrants from Austria ($62,164, a difference of 0.17%), Immigrants from Czechoslovakia ($62,217, a difference of 0.26%), Bulgarian ($62,378, a difference of 0.52%), and Cambodian ($62,516, a difference of 0.74%).
| Demographics | Rating | Rank | Median Male Earnings |
| Asians | 100.0 /100 | #29 | Exceptional $63,827 |
| Immigrants | France | 100.0 /100 | #30 | Exceptional $63,715 |
| Latvians | 100.0 /100 | #31 | Exceptional $63,498 |
| Soviet Union | 100.0 /100 | #32 | Exceptional $63,382 |
| Immigrants | Lithuania | 100.0 /100 | #33 | Exceptional $63,346 |
| Immigrants | Russia | 100.0 /100 | #34 | Exceptional $63,326 |
| Immigrants | Asia | 100.0 /100 | #35 | Exceptional $63,240 |
| Israelis | 100.0 /100 | #36 | Exceptional $63,228 |
| Immigrants | Sri Lanka | 100.0 /100 | #37 | Exceptional $63,099 |
| Maltese | 100.0 /100 | #38 | Exceptional $62,953 |
| Immigrants | South Africa | 100.0 /100 | #39 | Exceptional $62,899 |
| Australians | 100.0 /100 | #40 | Exceptional $62,857 |
| Immigrants | Turkey | 100.0 /100 | #41 | Exceptional $62,728 |
| Immigrants | Greece | 100.0 /100 | #42 | Exceptional $62,689 |
| Immigrants | Belarus | 100.0 /100 | #43 | Exceptional $62,658 |
| Cambodians | 100.0 /100 | #44 | Exceptional $62,516 |
| Bulgarians | 100.0 /100 | #45 | Exceptional $62,378 |
| Immigrants | Czechoslovakia | 99.9 /100 | #46 | Exceptional $62,217 |
| Immigrants | Austria | 99.9 /100 | #47 | Exceptional $62,164 |
| Immigrants | Malaysia | 99.9 /100 | #48 | Exceptional $62,121 |
| Immigrants | Europe | 99.9 /100 | #49 | Exceptional $62,057 |