Immigrants from North Macedonia vs Hispanic or Latino Wage/Income Gap
COMPARE
Immigrants from North Macedonia
Hispanic or Latino
Wage/Income Gap
Wage/Income Gap Comparison
Immigrants from North Macedonia
Hispanics or Latinos
28.4%
WAGE/INCOME GAP
0.2/ 100
METRIC RATING
299th/ 347
METRIC RANK
24.9%
WAGE/INCOME GAP
89.5/ 100
METRIC RATING
139th/ 347
METRIC RANK
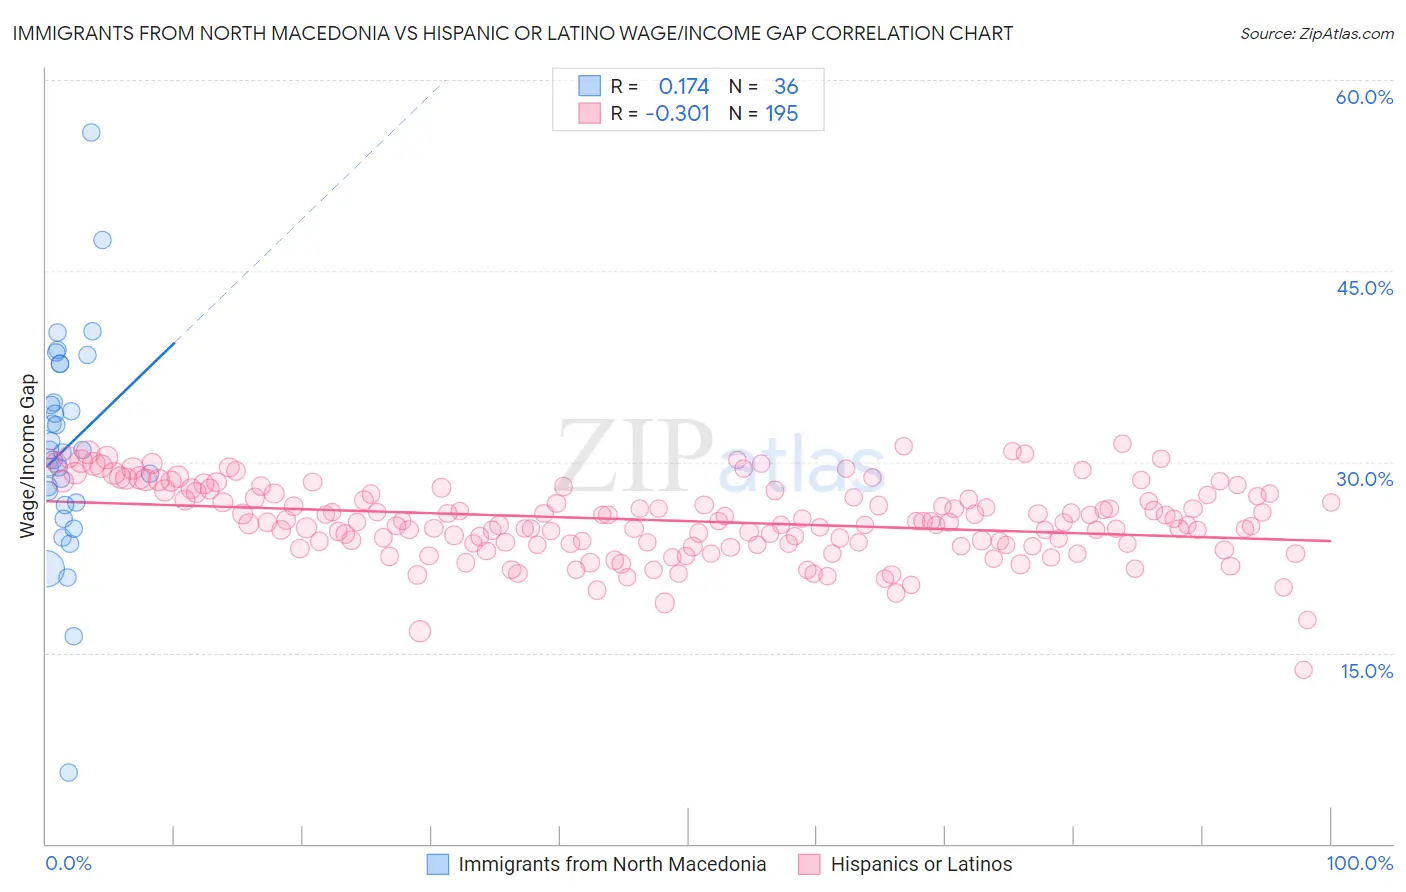
Immigrants from North Macedonia vs Hispanic or Latino Wage/Income Gap Correlation Chart
The statistical analysis conducted on geographies consisting of 74,314,405 people shows a poor positive correlation between the proportion of Immigrants from North Macedonia and wage/income gap percentage in the United States with a correlation coefficient (R) of 0.174 and weighted average of 28.4%. Similarly, the statistical analysis conducted on geographies consisting of 570,699,475 people shows a mild negative correlation between the proportion of Hispanics or Latinos and wage/income gap percentage in the United States with a correlation coefficient (R) of -0.301 and weighted average of 24.9%, a difference of 14.3%.
Wage/Income Gap Correlation Summary
| Measurement | Immigrants from North Macedonia | Hispanic or Latino |
| Minimum | 5.6% | 13.7% |
| Maximum | 55.9% | 31.5% |
| Range | 50.3% | 17.8% |
| Mean | 31.1% | 25.4% |
| Median | 30.8% | 25.3% |
| Interquartile 25% (IQ1) | 26.7% | 23.6% |
| Interquartile 75% (IQ3) | 36.2% | 27.5% |
| Interquartile Range (IQR) | 9.4% | 3.9% |
| Standard Deviation (Sample) | 8.7% | 2.9% |
| Standard Deviation (Population) | 8.6% | 2.9% |
Similar Demographics by Wage/Income Gap
Demographics Similar to Immigrants from North Macedonia by Wage/Income Gap
In terms of wage/income gap, the demographic groups most similar to Immigrants from North Macedonia are Immigrants from North America (28.4%, a difference of 0.050%), Austrian (28.4%, a difference of 0.050%), Immigrants from Northern Europe (28.5%, a difference of 0.12%), Immigrants from Canada (28.5%, a difference of 0.16%), and Scotch-Irish (28.5%, a difference of 0.19%).
| Demographics | Rating | Rank | Wage/Income Gap |
| Immigrants | Australia | 0.3 /100 | #292 | Tragic 28.2% |
| Immigrants | Israel | 0.3 /100 | #293 | Tragic 28.2% |
| Greeks | 0.3 /100 | #294 | Tragic 28.2% |
| Slovenes | 0.3 /100 | #295 | Tragic 28.3% |
| Northern Europeans | 0.3 /100 | #296 | Tragic 28.3% |
| Immigrants | North America | 0.2 /100 | #297 | Tragic 28.4% |
| Austrians | 0.2 /100 | #298 | Tragic 28.4% |
| Immigrants | North Macedonia | 0.2 /100 | #299 | Tragic 28.4% |
| Immigrants | Northern Europe | 0.2 /100 | #300 | Tragic 28.5% |
| Immigrants | Canada | 0.2 /100 | #301 | Tragic 28.5% |
| Scotch-Irish | 0.2 /100 | #302 | Tragic 28.5% |
| Irish | 0.2 /100 | #303 | Tragic 28.5% |
| Immigrants | Netherlands | 0.2 /100 | #304 | Tragic 28.5% |
| Immigrants | South Africa | 0.1 /100 | #305 | Tragic 28.5% |
| Whites/Caucasians | 0.1 /100 | #306 | Tragic 28.5% |
Demographics Similar to Hispanics or Latinos by Wage/Income Gap
In terms of wage/income gap, the demographic groups most similar to Hispanics or Latinos are Immigrants from Nepal (24.9%, a difference of 0.030%), Hawaiian (24.9%, a difference of 0.040%), Immigrants from Bosnia and Herzegovina (24.8%, a difference of 0.11%), Afghan (24.9%, a difference of 0.24%), and Immigrants from Uganda (24.9%, a difference of 0.25%).
| Demographics | Rating | Rank | Wage/Income Gap |
| Immigrants | Costa Rica | 92.4 /100 | #132 | Exceptional 24.7% |
| Colombians | 92.4 /100 | #133 | Exceptional 24.7% |
| Mexican American Indians | 92.2 /100 | #134 | Exceptional 24.7% |
| South American Indians | 92.0 /100 | #135 | Exceptional 24.7% |
| Armenians | 91.3 /100 | #136 | Exceptional 24.8% |
| Immigrants | South Eastern Asia | 90.9 /100 | #137 | Exceptional 24.8% |
| Immigrants | Bosnia and Herzegovina | 90.1 /100 | #138 | Exceptional 24.8% |
| Hispanics or Latinos | 89.5 /100 | #139 | Excellent 24.9% |
| Immigrants | Nepal | 89.3 /100 | #140 | Excellent 24.9% |
| Hawaiians | 89.3 /100 | #141 | Excellent 24.9% |
| Afghans | 88.1 /100 | #142 | Excellent 24.9% |
| Immigrants | Uganda | 88.0 /100 | #143 | Excellent 24.9% |
| Chippewa | 86.9 /100 | #144 | Excellent 25.0% |
| Comanche | 85.2 /100 | #145 | Excellent 25.0% |
| South Americans | 85.2 /100 | #146 | Excellent 25.0% |