Immigrants from Latin America vs Immigrants from Uruguay Householder Income Ages 25 - 44 years
COMPARE
Immigrants from Latin America
Immigrants from Uruguay
Householder Income Ages 25 - 44 years
Householder Income Ages 25 - 44 years Comparison
Immigrants from Latin America
Immigrants from Uruguay
$82,166
HOUSEHOLDER INCOME AGES 25 - 44 YEARS
0.1/ 100
METRIC RATING
287th/ 347
METRIC RANK
$91,171
HOUSEHOLDER INCOME AGES 25 - 44 YEARS
13.2/ 100
METRIC RATING
209th/ 347
METRIC RANK
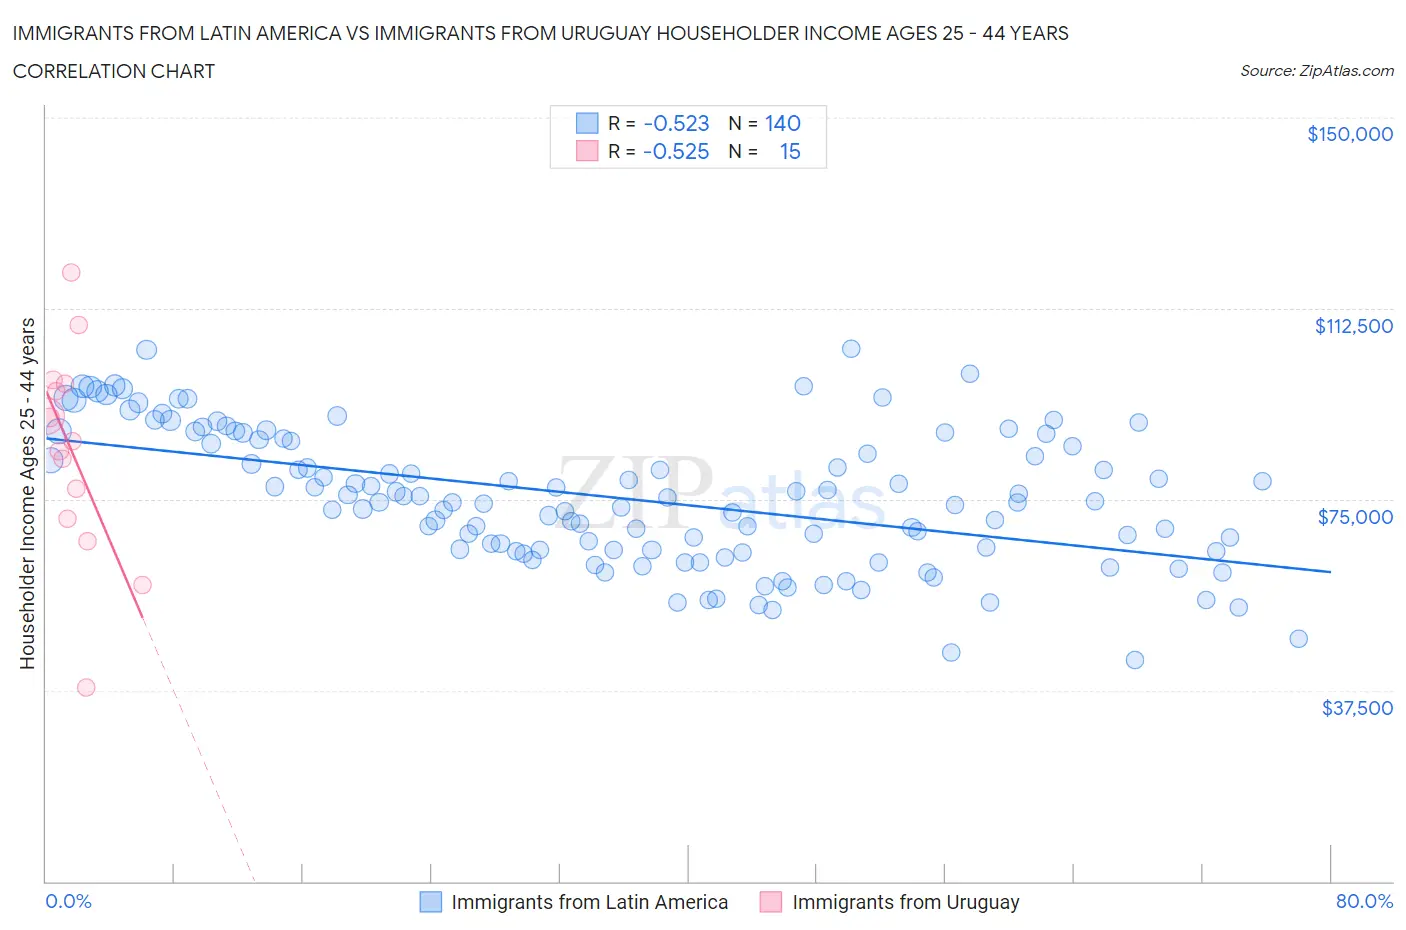
Immigrants from Latin America vs Immigrants from Uruguay Householder Income Ages 25 - 44 years Correlation Chart
The statistical analysis conducted on geographies consisting of 553,849,176 people shows a substantial negative correlation between the proportion of Immigrants from Latin America and household income with householder between the ages 25 and 44 in the United States with a correlation coefficient (R) of -0.523 and weighted average of $82,166. Similarly, the statistical analysis conducted on geographies consisting of 133,181,410 people shows a substantial negative correlation between the proportion of Immigrants from Uruguay and household income with householder between the ages 25 and 44 in the United States with a correlation coefficient (R) of -0.525 and weighted average of $91,171, a difference of 11.0%.
Householder Income Ages 25 - 44 years Correlation Summary
| Measurement | Immigrants from Latin America | Immigrants from Uruguay |
| Minimum | $43,333 | $38,006 |
| Maximum | $104,675 | $119,559 |
| Range | $61,342 | $81,553 |
| Mean | $75,262 | $84,577 |
| Median | $74,553 | $86,424 |
| Interquartile 25% (IQ1) | $65,072 | $71,202 |
| Interquartile 75% (IQ3) | $86,812 | $97,689 |
| Interquartile Range (IQR) | $21,740 | $26,487 |
| Standard Deviation (Sample) | $13,368 | $20,417 |
| Standard Deviation (Population) | $13,320 | $19,725 |
Similar Demographics by Householder Income Ages 25 - 44 years
Demographics Similar to Immigrants from Latin America by Householder Income Ages 25 - 44 years
In terms of householder income ages 25 - 44 years, the demographic groups most similar to Immigrants from Latin America are Ute ($82,166, a difference of 0.0%), Comanche ($82,152, a difference of 0.020%), Immigrants from Somalia ($82,188, a difference of 0.030%), Immigrants from Middle Africa ($82,254, a difference of 0.11%), and Shoshone ($82,062, a difference of 0.13%).
| Demographics | Rating | Rank | Householder Income Ages 25 - 44 years |
| Colville | 0.1 /100 | #280 | Tragic $82,604 |
| Cajuns | 0.1 /100 | #281 | Tragic $82,393 |
| Central American Indians | 0.1 /100 | #282 | Tragic $82,355 |
| Guatemalans | 0.1 /100 | #283 | Tragic $82,331 |
| Immigrants | Middle Africa | 0.1 /100 | #284 | Tragic $82,254 |
| Immigrants | Somalia | 0.1 /100 | #285 | Tragic $82,188 |
| Ute | 0.1 /100 | #286 | Tragic $82,166 |
| Immigrants | Latin America | 0.1 /100 | #287 | Tragic $82,166 |
| Comanche | 0.1 /100 | #288 | Tragic $82,152 |
| Shoshone | 0.1 /100 | #289 | Tragic $82,062 |
| Liberians | 0.1 /100 | #290 | Tragic $82,005 |
| Potawatomi | 0.1 /100 | #291 | Tragic $81,774 |
| Yaqui | 0.1 /100 | #292 | Tragic $81,656 |
| Blackfeet | 0.1 /100 | #293 | Tragic $81,531 |
| Cubans | 0.1 /100 | #294 | Tragic $81,483 |
Demographics Similar to Immigrants from Uruguay by Householder Income Ages 25 - 44 years
In terms of householder income ages 25 - 44 years, the demographic groups most similar to Immigrants from Uruguay are Immigrants from Thailand ($91,337, a difference of 0.18%), Aleut ($91,370, a difference of 0.22%), Yugoslavian ($91,368, a difference of 0.22%), Immigrants from Eastern Africa ($91,458, a difference of 0.32%), and Nepalese ($91,498, a difference of 0.36%).
| Demographics | Rating | Rank | Householder Income Ages 25 - 44 years |
| Ecuadorians | 16.0 /100 | #202 | Poor $91,574 |
| Immigrants | Cambodia | 15.7 /100 | #203 | Poor $91,533 |
| Nepalese | 15.4 /100 | #204 | Poor $91,498 |
| Immigrants | Eastern Africa | 15.2 /100 | #205 | Poor $91,458 |
| Aleuts | 14.5 /100 | #206 | Poor $91,370 |
| Yugoslavians | 14.5 /100 | #207 | Poor $91,368 |
| Immigrants | Thailand | 14.3 /100 | #208 | Poor $91,337 |
| Immigrants | Uruguay | 13.2 /100 | #209 | Poor $91,171 |
| Immigrants | Kenya | 10.9 /100 | #210 | Poor $90,767 |
| Iraqis | 10.8 /100 | #211 | Poor $90,764 |
| Hawaiians | 10.6 /100 | #212 | Poor $90,722 |
| Immigrants | Bangladesh | 9.3 /100 | #213 | Tragic $90,448 |
| Immigrants | Africa | 8.9 /100 | #214 | Tragic $90,372 |
| Panamanians | 8.1 /100 | #215 | Tragic $90,193 |
| Ghanaians | 7.9 /100 | #216 | Tragic $90,137 |