Egyptian vs Immigrants from Uruguay Householder Income Ages 25 - 44 years
COMPARE
Egyptian
Immigrants from Uruguay
Householder Income Ages 25 - 44 years
Householder Income Ages 25 - 44 years Comparison
Egyptians
Immigrants from Uruguay
$105,282
HOUSEHOLDER INCOME AGES 25 - 44 YEARS
99.7/ 100
METRIC RATING
60th/ 347
METRIC RANK
$91,171
HOUSEHOLDER INCOME AGES 25 - 44 YEARS
13.2/ 100
METRIC RATING
209th/ 347
METRIC RANK
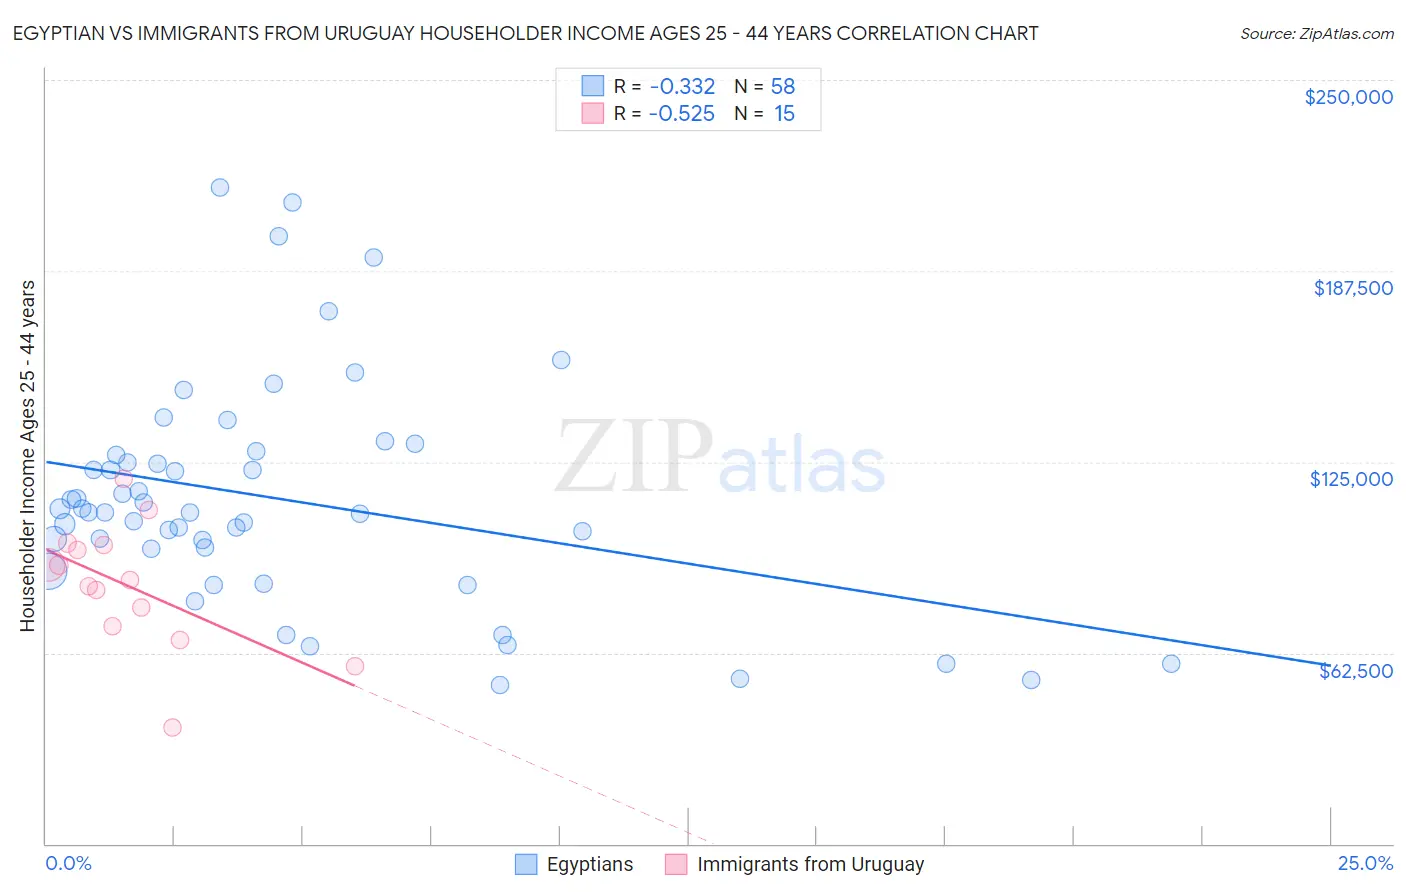
Egyptian vs Immigrants from Uruguay Householder Income Ages 25 - 44 years Correlation Chart
The statistical analysis conducted on geographies consisting of 276,427,528 people shows a mild negative correlation between the proportion of Egyptians and household income with householder between the ages 25 and 44 in the United States with a correlation coefficient (R) of -0.332 and weighted average of $105,282. Similarly, the statistical analysis conducted on geographies consisting of 133,181,410 people shows a substantial negative correlation between the proportion of Immigrants from Uruguay and household income with householder between the ages 25 and 44 in the United States with a correlation coefficient (R) of -0.525 and weighted average of $91,171, a difference of 15.5%.
Householder Income Ages 25 - 44 years Correlation Summary
| Measurement | Egyptian | Immigrants from Uruguay |
| Minimum | $52,083 | $38,006 |
| Maximum | $214,879 | $119,559 |
| Range | $162,796 | $81,553 |
| Mean | $112,843 | $84,577 |
| Median | $108,598 | $86,424 |
| Interquartile 25% (IQ1) | $96,583 | $71,202 |
| Interquartile 75% (IQ3) | $127,216 | $97,689 |
| Interquartile Range (IQR) | $30,633 | $26,487 |
| Standard Deviation (Sample) | $36,905 | $20,417 |
| Standard Deviation (Population) | $36,586 | $19,725 |
Similar Demographics by Householder Income Ages 25 - 44 years
Demographics Similar to Egyptians by Householder Income Ages 25 - 44 years
In terms of householder income ages 25 - 44 years, the demographic groups most similar to Egyptians are Lithuanian ($105,223, a difference of 0.060%), Immigrants from Italy ($105,201, a difference of 0.080%), Immigrants from Scotland ($105,089, a difference of 0.18%), New Zealander ($105,085, a difference of 0.19%), and Immigrants from Netherlands ($105,082, a difference of 0.19%).
| Demographics | Rating | Rank | Householder Income Ages 25 - 44 years |
| Immigrants | Norway | 99.9 /100 | #53 | Exceptional $106,629 |
| Paraguayans | 99.9 /100 | #54 | Exceptional $106,615 |
| Greeks | 99.9 /100 | #55 | Exceptional $106,457 |
| Immigrants | Pakistan | 99.8 /100 | #56 | Exceptional $106,129 |
| Immigrants | Austria | 99.8 /100 | #57 | Exceptional $106,103 |
| Immigrants | South Africa | 99.8 /100 | #58 | Exceptional $105,748 |
| Immigrants | Latvia | 99.8 /100 | #59 | Exceptional $105,522 |
| Egyptians | 99.7 /100 | #60 | Exceptional $105,282 |
| Lithuanians | 99.7 /100 | #61 | Exceptional $105,223 |
| Immigrants | Italy | 99.7 /100 | #62 | Exceptional $105,201 |
| Immigrants | Scotland | 99.7 /100 | #63 | Exceptional $105,089 |
| New Zealanders | 99.7 /100 | #64 | Exceptional $105,085 |
| Immigrants | Netherlands | 99.7 /100 | #65 | Exceptional $105,082 |
| Laotians | 99.7 /100 | #66 | Exceptional $104,993 |
| Immigrants | Romania | 99.6 /100 | #67 | Exceptional $104,713 |
Demographics Similar to Immigrants from Uruguay by Householder Income Ages 25 - 44 years
In terms of householder income ages 25 - 44 years, the demographic groups most similar to Immigrants from Uruguay are Immigrants from Thailand ($91,337, a difference of 0.18%), Aleut ($91,370, a difference of 0.22%), Yugoslavian ($91,368, a difference of 0.22%), Immigrants from Eastern Africa ($91,458, a difference of 0.32%), and Nepalese ($91,498, a difference of 0.36%).
| Demographics | Rating | Rank | Householder Income Ages 25 - 44 years |
| Ecuadorians | 16.0 /100 | #202 | Poor $91,574 |
| Immigrants | Cambodia | 15.7 /100 | #203 | Poor $91,533 |
| Nepalese | 15.4 /100 | #204 | Poor $91,498 |
| Immigrants | Eastern Africa | 15.2 /100 | #205 | Poor $91,458 |
| Aleuts | 14.5 /100 | #206 | Poor $91,370 |
| Yugoslavians | 14.5 /100 | #207 | Poor $91,368 |
| Immigrants | Thailand | 14.3 /100 | #208 | Poor $91,337 |
| Immigrants | Uruguay | 13.2 /100 | #209 | Poor $91,171 |
| Immigrants | Kenya | 10.9 /100 | #210 | Poor $90,767 |
| Iraqis | 10.8 /100 | #211 | Poor $90,764 |
| Hawaiians | 10.6 /100 | #212 | Poor $90,722 |
| Immigrants | Bangladesh | 9.3 /100 | #213 | Tragic $90,448 |
| Immigrants | Africa | 8.9 /100 | #214 | Tragic $90,372 |
| Panamanians | 8.1 /100 | #215 | Tragic $90,193 |
| Ghanaians | 7.9 /100 | #216 | Tragic $90,137 |