Immigrants from Kuwait vs Immigrants from Fiji Householder Income Under 25 years
COMPARE
Immigrants from Kuwait
Immigrants from Fiji
Householder Income Under 25 years
Householder Income Under 25 years Comparison
Immigrants from Kuwait
Immigrants from Fiji
$48,126
HOUSEHOLDER INCOME UNDER 25 YEARS
0.0/ 100
METRIC RATING
301st/ 347
METRIC RANK
$57,074
HOUSEHOLDER INCOME UNDER 25 YEARS
100.0/ 100
METRIC RATING
21st/ 347
METRIC RANK
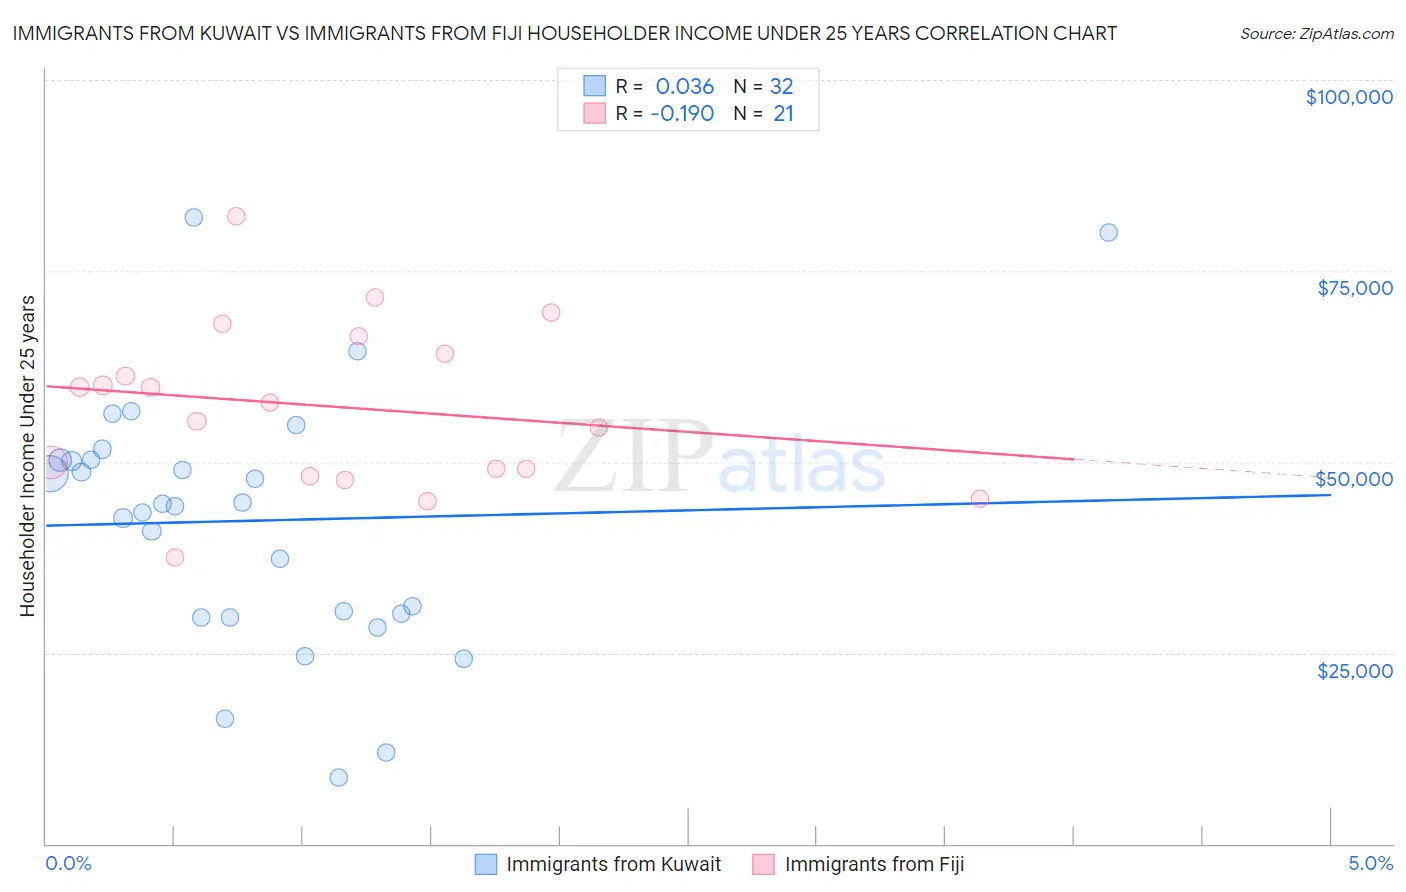
Immigrants from Kuwait vs Immigrants from Fiji Householder Income Under 25 years Correlation Chart
The statistical analysis conducted on geographies consisting of 126,358,958 people shows no correlation between the proportion of Immigrants from Kuwait and household income with householder under the age of 25 in the United States with a correlation coefficient (R) of 0.036 and weighted average of $48,126. Similarly, the statistical analysis conducted on geographies consisting of 87,171,556 people shows a poor negative correlation between the proportion of Immigrants from Fiji and household income with householder under the age of 25 in the United States with a correlation coefficient (R) of -0.190 and weighted average of $57,074, a difference of 18.6%.
Householder Income Under 25 years Correlation Summary
| Measurement | Immigrants from Kuwait | Immigrants from Fiji |
| Minimum | $8,680 | $37,496 |
| Maximum | $81,978 | $82,200 |
| Range | $73,298 | $44,704 |
| Mean | $42,291 | $57,221 |
| Median | $44,394 | $57,721 |
| Interquartile 25% (IQ1) | $29,899 | $48,616 |
| Interquartile 75% (IQ3) | $50,227 | $65,271 |
| Interquartile Range (IQR) | $20,328 | $16,655 |
| Standard Deviation (Sample) | $16,858 | $10,789 |
| Standard Deviation (Population) | $16,592 | $10,529 |
Similar Demographics by Householder Income Under 25 years
Demographics Similar to Immigrants from Kuwait by Householder Income Under 25 years
In terms of householder income under 25 years, the demographic groups most similar to Immigrants from Kuwait are Immigrants from Somalia ($48,135, a difference of 0.020%), Immigrants from Honduras ($48,267, a difference of 0.29%), Immigrants from Liberia ($47,981, a difference of 0.30%), Yaqui ($48,300, a difference of 0.36%), and Immigrants from Middle Africa ($47,916, a difference of 0.44%).
| Demographics | Rating | Rank | Householder Income Under 25 years |
| Somalis | 0.0 /100 | #294 | Tragic $48,657 |
| Central American Indians | 0.0 /100 | #295 | Tragic $48,643 |
| Blackfeet | 0.0 /100 | #296 | Tragic $48,603 |
| Cree | 0.0 /100 | #297 | Tragic $48,514 |
| Yaqui | 0.0 /100 | #298 | Tragic $48,300 |
| Immigrants | Honduras | 0.0 /100 | #299 | Tragic $48,267 |
| Immigrants | Somalia | 0.0 /100 | #300 | Tragic $48,135 |
| Immigrants | Kuwait | 0.0 /100 | #301 | Tragic $48,126 |
| Immigrants | Liberia | 0.0 /100 | #302 | Tragic $47,981 |
| Immigrants | Middle Africa | 0.0 /100 | #303 | Tragic $47,916 |
| Menominee | 0.0 /100 | #304 | Tragic $47,907 |
| Cherokee | 0.0 /100 | #305 | Tragic $47,848 |
| Natives/Alaskans | 0.0 /100 | #306 | Tragic $47,704 |
| Bangladeshis | 0.0 /100 | #307 | Tragic $47,589 |
| Comanche | 0.0 /100 | #308 | Tragic $47,518 |
Demographics Similar to Immigrants from Fiji by Householder Income Under 25 years
In terms of householder income under 25 years, the demographic groups most similar to Immigrants from Fiji are Immigrants from Ireland ($57,075, a difference of 0.0%), Bhutanese ($57,078, a difference of 0.010%), Immigrants from Eastern Asia ($57,123, a difference of 0.090%), Asian ($57,003, a difference of 0.12%), and Tongan ($56,972, a difference of 0.18%).
| Demographics | Rating | Rank | Householder Income Under 25 years |
| Filipinos | 100.0 /100 | #14 | Exceptional $57,740 |
| Koreans | 100.0 /100 | #15 | Exceptional $57,730 |
| Immigrants | Afghanistan | 100.0 /100 | #16 | Exceptional $57,478 |
| Sierra Leoneans | 100.0 /100 | #17 | Exceptional $57,272 |
| Immigrants | Eastern Asia | 100.0 /100 | #18 | Exceptional $57,123 |
| Bhutanese | 100.0 /100 | #19 | Exceptional $57,078 |
| Immigrants | Ireland | 100.0 /100 | #20 | Exceptional $57,075 |
| Immigrants | Fiji | 100.0 /100 | #21 | Exceptional $57,074 |
| Asians | 100.0 /100 | #22 | Exceptional $57,003 |
| Tongans | 100.0 /100 | #23 | Exceptional $56,972 |
| Immigrants | Singapore | 100.0 /100 | #24 | Exceptional $56,835 |
| Immigrants | Pakistan | 100.0 /100 | #25 | Exceptional $56,789 |
| Immigrants | Australia | 100.0 /100 | #26 | Exceptional $56,660 |
| Immigrants | North Macedonia | 100.0 /100 | #27 | Exceptional $56,503 |
| Immigrants | Peru | 100.0 /100 | #28 | Exceptional $56,384 |