Immigrants from Kuwait vs Bolivian Householder Income Under 25 years
COMPARE
Immigrants from Kuwait
Bolivian
Householder Income Under 25 years
Householder Income Under 25 years Comparison
Immigrants from Kuwait
Bolivians
$48,126
HOUSEHOLDER INCOME UNDER 25 YEARS
0.0/ 100
METRIC RATING
301st/ 347
METRIC RANK
$58,506
HOUSEHOLDER INCOME UNDER 25 YEARS
100.0/ 100
METRIC RATING
7th/ 347
METRIC RANK
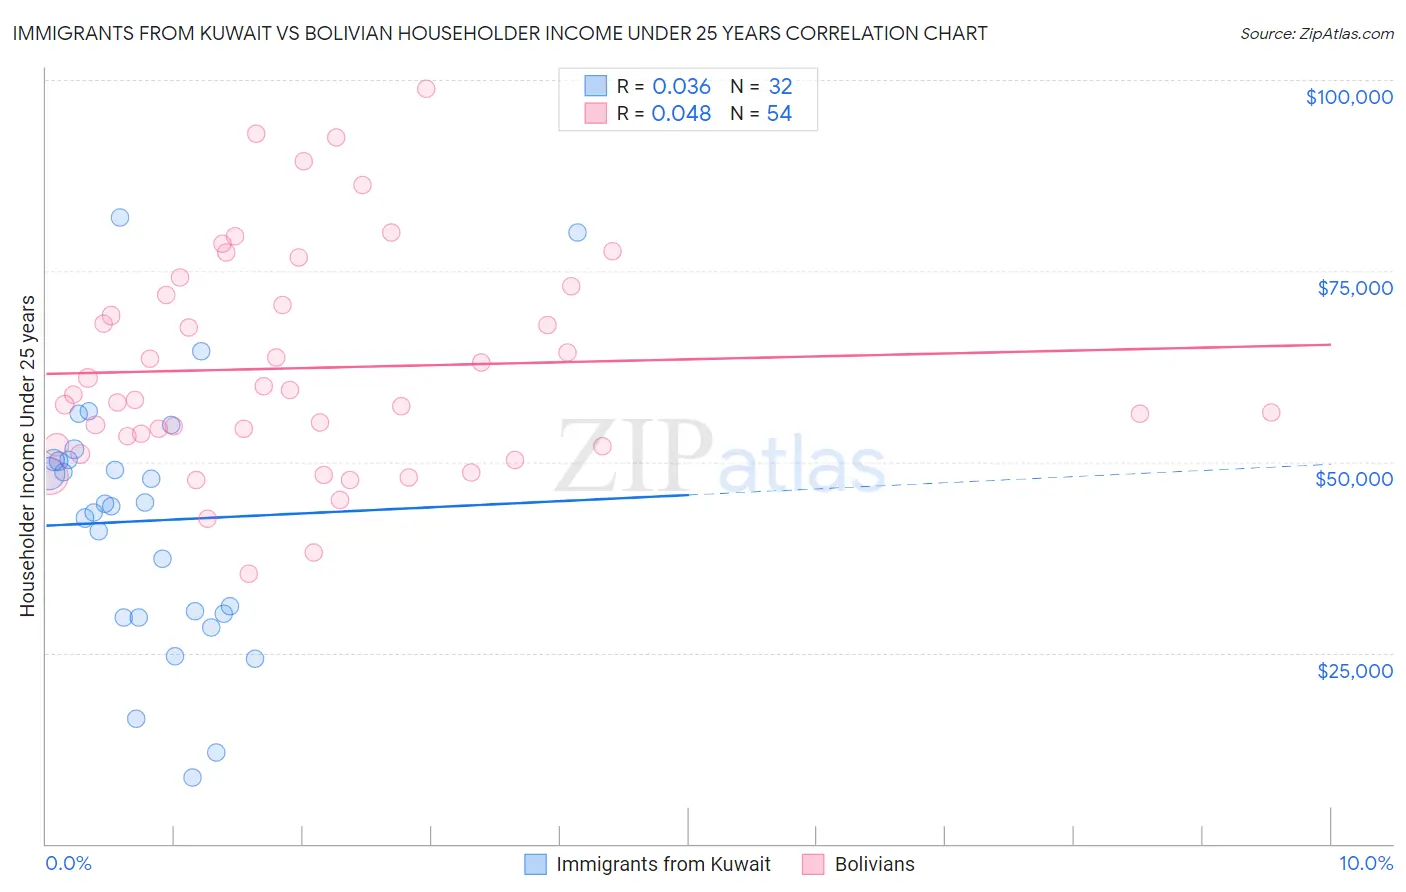
Immigrants from Kuwait vs Bolivian Householder Income Under 25 years Correlation Chart
The statistical analysis conducted on geographies consisting of 126,358,958 people shows no correlation between the proportion of Immigrants from Kuwait and household income with householder under the age of 25 in the United States with a correlation coefficient (R) of 0.036 and weighted average of $48,126. Similarly, the statistical analysis conducted on geographies consisting of 166,062,269 people shows no correlation between the proportion of Bolivians and household income with householder under the age of 25 in the United States with a correlation coefficient (R) of 0.048 and weighted average of $58,506, a difference of 21.6%.
Householder Income Under 25 years Correlation Summary
| Measurement | Immigrants from Kuwait | Bolivian |
| Minimum | $8,680 | $35,342 |
| Maximum | $81,978 | $98,935 |
| Range | $73,298 | $63,593 |
| Mean | $42,291 | $62,297 |
| Median | $44,394 | $58,422 |
| Interquartile 25% (IQ1) | $29,899 | $52,223 |
| Interquartile 75% (IQ3) | $50,227 | $71,837 |
| Interquartile Range (IQR) | $20,328 | $19,614 |
| Standard Deviation (Sample) | $16,858 | $14,374 |
| Standard Deviation (Population) | $16,592 | $14,241 |
Similar Demographics by Householder Income Under 25 years
Demographics Similar to Immigrants from Kuwait by Householder Income Under 25 years
In terms of householder income under 25 years, the demographic groups most similar to Immigrants from Kuwait are Immigrants from Somalia ($48,135, a difference of 0.020%), Immigrants from Honduras ($48,267, a difference of 0.29%), Immigrants from Liberia ($47,981, a difference of 0.30%), Yaqui ($48,300, a difference of 0.36%), and Immigrants from Middle Africa ($47,916, a difference of 0.44%).
| Demographics | Rating | Rank | Householder Income Under 25 years |
| Somalis | 0.0 /100 | #294 | Tragic $48,657 |
| Central American Indians | 0.0 /100 | #295 | Tragic $48,643 |
| Blackfeet | 0.0 /100 | #296 | Tragic $48,603 |
| Cree | 0.0 /100 | #297 | Tragic $48,514 |
| Yaqui | 0.0 /100 | #298 | Tragic $48,300 |
| Immigrants | Honduras | 0.0 /100 | #299 | Tragic $48,267 |
| Immigrants | Somalia | 0.0 /100 | #300 | Tragic $48,135 |
| Immigrants | Kuwait | 0.0 /100 | #301 | Tragic $48,126 |
| Immigrants | Liberia | 0.0 /100 | #302 | Tragic $47,981 |
| Immigrants | Middle Africa | 0.0 /100 | #303 | Tragic $47,916 |
| Menominee | 0.0 /100 | #304 | Tragic $47,907 |
| Cherokee | 0.0 /100 | #305 | Tragic $47,848 |
| Natives/Alaskans | 0.0 /100 | #306 | Tragic $47,704 |
| Bangladeshis | 0.0 /100 | #307 | Tragic $47,589 |
| Comanche | 0.0 /100 | #308 | Tragic $47,518 |
Demographics Similar to Bolivians by Householder Income Under 25 years
In terms of householder income under 25 years, the demographic groups most similar to Bolivians are Indian (Asian) ($58,239, a difference of 0.46%), Chinese ($58,162, a difference of 0.59%), Afghan ($58,019, a difference of 0.84%), Immigrants from China ($57,931, a difference of 0.99%), and Immigrants from Philippines ($57,930, a difference of 1.0%).
| Demographics | Rating | Rank | Householder Income Under 25 years |
| Assyrians/Chaldeans/Syriacs | 100.0 /100 | #1 | Exceptional $65,329 |
| Immigrants | Hong Kong | 100.0 /100 | #2 | Exceptional $62,083 |
| Immigrants | India | 100.0 /100 | #3 | Exceptional $59,914 |
| Immigrants | Taiwan | 100.0 /100 | #4 | Exceptional $59,424 |
| Immigrants | Bolivia | 100.0 /100 | #5 | Exceptional $59,389 |
| Thais | 100.0 /100 | #6 | Exceptional $59,187 |
| Bolivians | 100.0 /100 | #7 | Exceptional $58,506 |
| Indians (Asian) | 100.0 /100 | #8 | Exceptional $58,239 |
| Chinese | 100.0 /100 | #9 | Exceptional $58,162 |
| Afghans | 100.0 /100 | #10 | Exceptional $58,019 |
| Immigrants | China | 100.0 /100 | #11 | Exceptional $57,931 |
| Immigrants | Philippines | 100.0 /100 | #12 | Exceptional $57,930 |
| Immigrants | South Central Asia | 100.0 /100 | #13 | Exceptional $57,818 |
| Filipinos | 100.0 /100 | #14 | Exceptional $57,740 |
| Koreans | 100.0 /100 | #15 | Exceptional $57,730 |