Immigrants from Japan vs Immigrants from Iraq Householder Income Under 25 years
COMPARE
Immigrants from Japan
Immigrants from Iraq
Householder Income Under 25 years
Householder Income Under 25 years Comparison
Immigrants from Japan
Immigrants from Iraq
$55,932
HOUSEHOLDER INCOME UNDER 25 YEARS
100.0/ 100
METRIC RATING
34th/ 347
METRIC RANK
$53,384
HOUSEHOLDER INCOME UNDER 25 YEARS
94.9/ 100
METRIC RATING
123rd/ 347
METRIC RANK
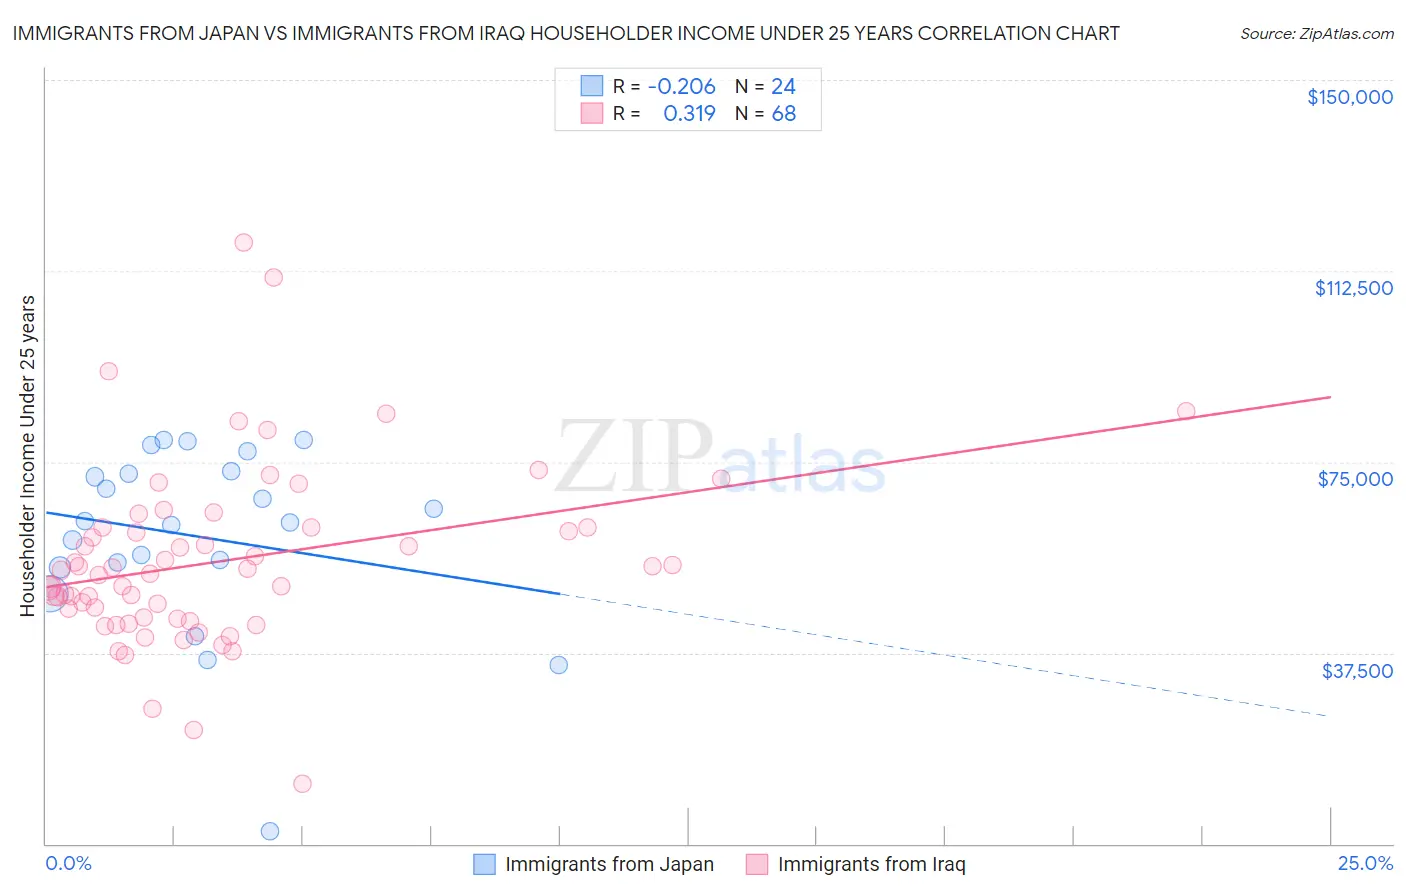
Immigrants from Japan vs Immigrants from Iraq Householder Income Under 25 years Correlation Chart
The statistical analysis conducted on geographies consisting of 293,469,097 people shows a weak negative correlation between the proportion of Immigrants from Japan and household income with householder under the age of 25 in the United States with a correlation coefficient (R) of -0.206 and weighted average of $55,932. Similarly, the statistical analysis conducted on geographies consisting of 177,702,127 people shows a mild positive correlation between the proportion of Immigrants from Iraq and household income with householder under the age of 25 in the United States with a correlation coefficient (R) of 0.319 and weighted average of $53,384, a difference of 4.8%.
Householder Income Under 25 years Correlation Summary
| Measurement | Immigrants from Japan | Immigrants from Iraq |
| Minimum | $2,499 | $11,835 |
| Maximum | $79,188 | $117,992 |
| Range | $76,689 | $106,157 |
| Mean | $60,335 | $55,491 |
| Median | $63,191 | $53,349 |
| Interquartile 25% (IQ1) | $54,827 | $44,386 |
| Interquartile 75% (IQ3) | $72,990 | $62,069 |
| Interquartile Range (IQR) | $18,164 | $17,683 |
| Standard Deviation (Sample) | $18,036 | $17,748 |
| Standard Deviation (Population) | $17,656 | $17,617 |
Similar Demographics by Householder Income Under 25 years
Demographics Similar to Immigrants from Japan by Householder Income Under 25 years
In terms of householder income under 25 years, the demographic groups most similar to Immigrants from Japan are Inupiat ($55,935, a difference of 0.010%), Tlingit-Haida ($55,914, a difference of 0.030%), Immigrants from Israel ($55,913, a difference of 0.030%), Immigrants from Russia ($55,891, a difference of 0.070%), and Immigrants from Iran ($55,880, a difference of 0.090%).
| Demographics | Rating | Rank | Householder Income Under 25 years |
| Immigrants | North Macedonia | 100.0 /100 | #27 | Exceptional $56,503 |
| Immigrants | Peru | 100.0 /100 | #28 | Exceptional $56,384 |
| Immigrants | Asia | 100.0 /100 | #29 | Exceptional $56,379 |
| Immigrants | Moldova | 100.0 /100 | #30 | Exceptional $56,168 |
| Vietnamese | 100.0 /100 | #31 | Exceptional $56,127 |
| Peruvians | 100.0 /100 | #32 | Exceptional $56,052 |
| Inupiat | 100.0 /100 | #33 | Exceptional $55,935 |
| Immigrants | Japan | 100.0 /100 | #34 | Exceptional $55,932 |
| Tlingit-Haida | 100.0 /100 | #35 | Exceptional $55,914 |
| Immigrants | Israel | 100.0 /100 | #36 | Exceptional $55,913 |
| Immigrants | Russia | 100.0 /100 | #37 | Exceptional $55,891 |
| Immigrants | Iran | 100.0 /100 | #38 | Exceptional $55,880 |
| Immigrants | Belarus | 100.0 /100 | #39 | Exceptional $55,743 |
| Immigrants | Greece | 100.0 /100 | #40 | Exceptional $55,727 |
| Immigrants | Guyana | 100.0 /100 | #41 | Exceptional $55,726 |
Demographics Similar to Immigrants from Iraq by Householder Income Under 25 years
In terms of householder income under 25 years, the demographic groups most similar to Immigrants from Iraq are Immigrants from Ethiopia ($53,408, a difference of 0.040%), Immigrants from Canada ($53,411, a difference of 0.050%), Colombian ($53,357, a difference of 0.050%), Guamanian/Chamorro ($53,423, a difference of 0.070%), and Italian ($53,426, a difference of 0.080%).
| Demographics | Rating | Rank | Householder Income Under 25 years |
| Immigrants | Spain | 96.6 /100 | #116 | Exceptional $53,560 |
| Lithuanians | 96.6 /100 | #117 | Exceptional $53,552 |
| Immigrants | Switzerland | 96.3 /100 | #118 | Exceptional $53,528 |
| Italians | 95.4 /100 | #119 | Exceptional $53,426 |
| Guamanians/Chamorros | 95.3 /100 | #120 | Exceptional $53,423 |
| Immigrants | Canada | 95.2 /100 | #121 | Exceptional $53,411 |
| Immigrants | Ethiopia | 95.2 /100 | #122 | Exceptional $53,408 |
| Immigrants | Iraq | 94.9 /100 | #123 | Exceptional $53,384 |
| Colombians | 94.6 /100 | #124 | Exceptional $53,357 |
| Pakistanis | 94.1 /100 | #125 | Exceptional $53,325 |
| Immigrants | Serbia | 94.1 /100 | #126 | Exceptional $53,321 |
| Immigrants | North America | 93.9 /100 | #127 | Exceptional $53,307 |
| Immigrants | Bulgaria | 93.9 /100 | #128 | Exceptional $53,305 |
| New Zealanders | 93.7 /100 | #129 | Exceptional $53,294 |
| Nicaraguans | 93.4 /100 | #130 | Exceptional $53,275 |