Immigrants from Guatemala vs Immigrants from Iraq Householder Income Under 25 years
COMPARE
Immigrants from Guatemala
Immigrants from Iraq
Householder Income Under 25 years
Householder Income Under 25 years Comparison
Immigrants from Guatemala
Immigrants from Iraq
$51,447
HOUSEHOLDER INCOME UNDER 25 YEARS
14.0/ 100
METRIC RATING
202nd/ 347
METRIC RANK
$53,384
HOUSEHOLDER INCOME UNDER 25 YEARS
94.9/ 100
METRIC RATING
123rd/ 347
METRIC RANK
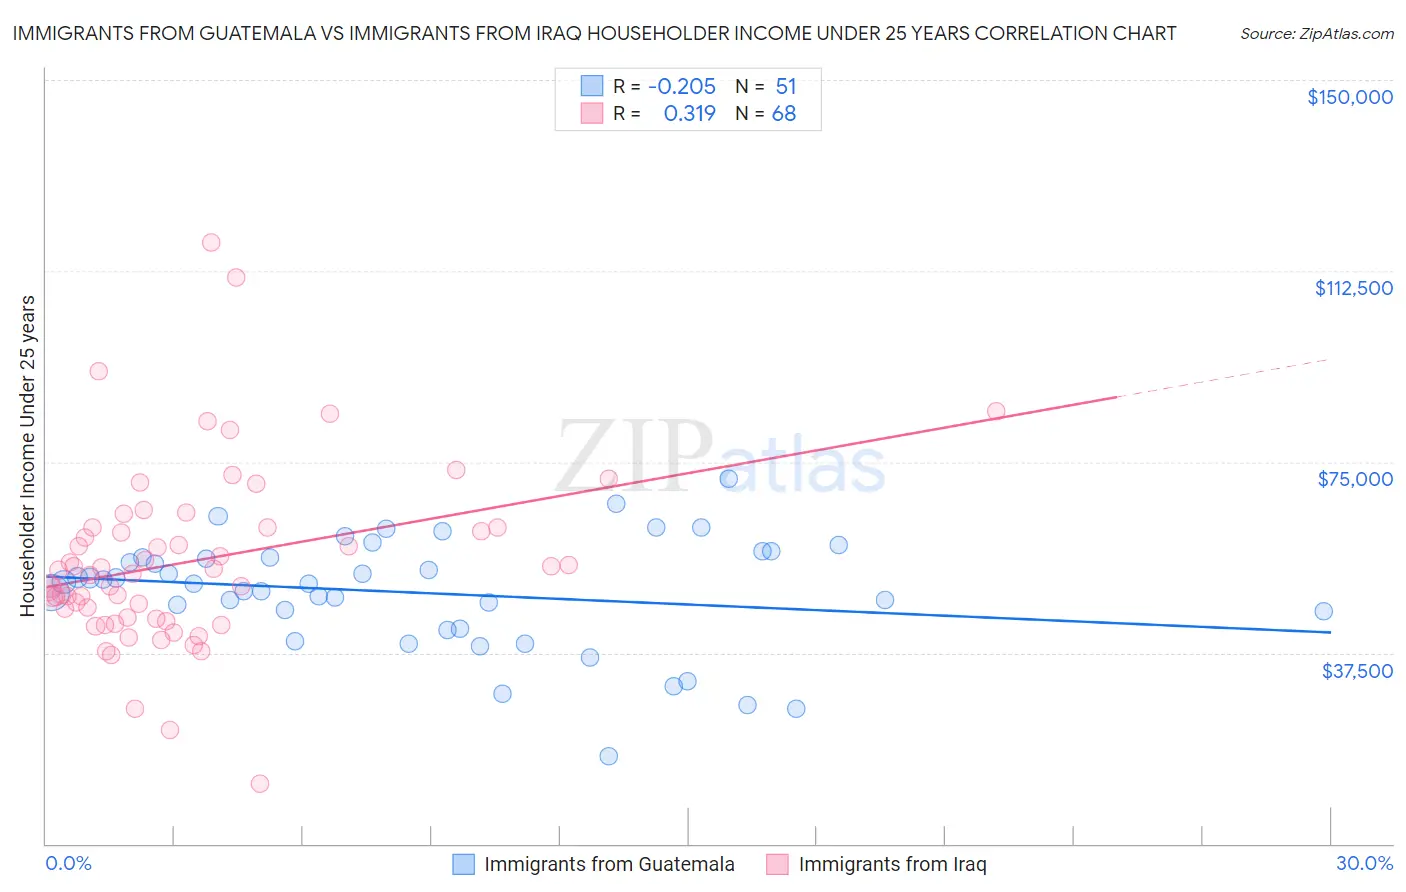
Immigrants from Guatemala vs Immigrants from Iraq Householder Income Under 25 years Correlation Chart
The statistical analysis conducted on geographies consisting of 322,942,463 people shows a weak negative correlation between the proportion of Immigrants from Guatemala and household income with householder under the age of 25 in the United States with a correlation coefficient (R) of -0.205 and weighted average of $51,447. Similarly, the statistical analysis conducted on geographies consisting of 177,702,127 people shows a mild positive correlation between the proportion of Immigrants from Iraq and household income with householder under the age of 25 in the United States with a correlation coefficient (R) of 0.319 and weighted average of $53,384, a difference of 3.8%.
Householder Income Under 25 years Correlation Summary
| Measurement | Immigrants from Guatemala | Immigrants from Iraq |
| Minimum | $17,188 | $11,835 |
| Maximum | $71,705 | $117,992 |
| Range | $54,517 | $106,157 |
| Mean | $49,268 | $55,491 |
| Median | $51,116 | $53,349 |
| Interquartile 25% (IQ1) | $42,266 | $44,386 |
| Interquartile 75% (IQ3) | $56,271 | $62,069 |
| Interquartile Range (IQR) | $14,004 | $17,683 |
| Standard Deviation (Sample) | $11,118 | $17,748 |
| Standard Deviation (Population) | $11,008 | $17,617 |
Similar Demographics by Householder Income Under 25 years
Demographics Similar to Immigrants from Guatemala by Householder Income Under 25 years
In terms of householder income under 25 years, the demographic groups most similar to Immigrants from Guatemala are Immigrants from Cameroon ($51,433, a difference of 0.030%), Czech ($51,421, a difference of 0.050%), Immigrants from West Indies ($51,479, a difference of 0.060%), British ($51,477, a difference of 0.060%), and Immigrants from Syria ($51,494, a difference of 0.090%).
| Demographics | Rating | Rank | Householder Income Under 25 years |
| Estonians | 16.4 /100 | #195 | Poor $51,523 |
| Palestinians | 16.1 /100 | #196 | Poor $51,515 |
| Pima | 15.7 /100 | #197 | Poor $51,503 |
| Immigrants | Syria | 15.4 /100 | #198 | Poor $51,494 |
| Swiss | 15.4 /100 | #199 | Poor $51,493 |
| Immigrants | West Indies | 14.9 /100 | #200 | Poor $51,479 |
| British | 14.9 /100 | #201 | Poor $51,477 |
| Immigrants | Guatemala | 14.0 /100 | #202 | Poor $51,447 |
| Immigrants | Cameroon | 13.6 /100 | #203 | Poor $51,433 |
| Czechs | 13.2 /100 | #204 | Poor $51,421 |
| Cape Verdeans | 12.3 /100 | #205 | Poor $51,387 |
| Immigrants | Latin America | 12.3 /100 | #206 | Poor $51,387 |
| South Africans | 12.2 /100 | #207 | Poor $51,383 |
| Immigrants | Jordan | 11.9 /100 | #208 | Poor $51,370 |
| Syrians | 11.4 /100 | #209 | Poor $51,353 |
Demographics Similar to Immigrants from Iraq by Householder Income Under 25 years
In terms of householder income under 25 years, the demographic groups most similar to Immigrants from Iraq are Immigrants from Ethiopia ($53,408, a difference of 0.040%), Immigrants from Canada ($53,411, a difference of 0.050%), Colombian ($53,357, a difference of 0.050%), Guamanian/Chamorro ($53,423, a difference of 0.070%), and Italian ($53,426, a difference of 0.080%).
| Demographics | Rating | Rank | Householder Income Under 25 years |
| Immigrants | Spain | 96.6 /100 | #116 | Exceptional $53,560 |
| Lithuanians | 96.6 /100 | #117 | Exceptional $53,552 |
| Immigrants | Switzerland | 96.3 /100 | #118 | Exceptional $53,528 |
| Italians | 95.4 /100 | #119 | Exceptional $53,426 |
| Guamanians/Chamorros | 95.3 /100 | #120 | Exceptional $53,423 |
| Immigrants | Canada | 95.2 /100 | #121 | Exceptional $53,411 |
| Immigrants | Ethiopia | 95.2 /100 | #122 | Exceptional $53,408 |
| Immigrants | Iraq | 94.9 /100 | #123 | Exceptional $53,384 |
| Colombians | 94.6 /100 | #124 | Exceptional $53,357 |
| Pakistanis | 94.1 /100 | #125 | Exceptional $53,325 |
| Immigrants | Serbia | 94.1 /100 | #126 | Exceptional $53,321 |
| Immigrants | North America | 93.9 /100 | #127 | Exceptional $53,307 |
| Immigrants | Bulgaria | 93.9 /100 | #128 | Exceptional $53,305 |
| New Zealanders | 93.7 /100 | #129 | Exceptional $53,294 |
| Nicaraguans | 93.4 /100 | #130 | Exceptional $53,275 |