Immigrants from India vs Immigrants from Burma/Myanmar Householder Income Under 25 years
COMPARE
Immigrants from India
Immigrants from Burma/Myanmar
Householder Income Under 25 years
Householder Income Under 25 years Comparison
Immigrants from India
Immigrants from Burma/Myanmar
$59,914
HOUSEHOLDER INCOME UNDER 25 YEARS
100.0/ 100
METRIC RATING
3rd/ 347
METRIC RANK
$48,749
HOUSEHOLDER INCOME UNDER 25 YEARS
0.0/ 100
METRIC RATING
291st/ 347
METRIC RANK
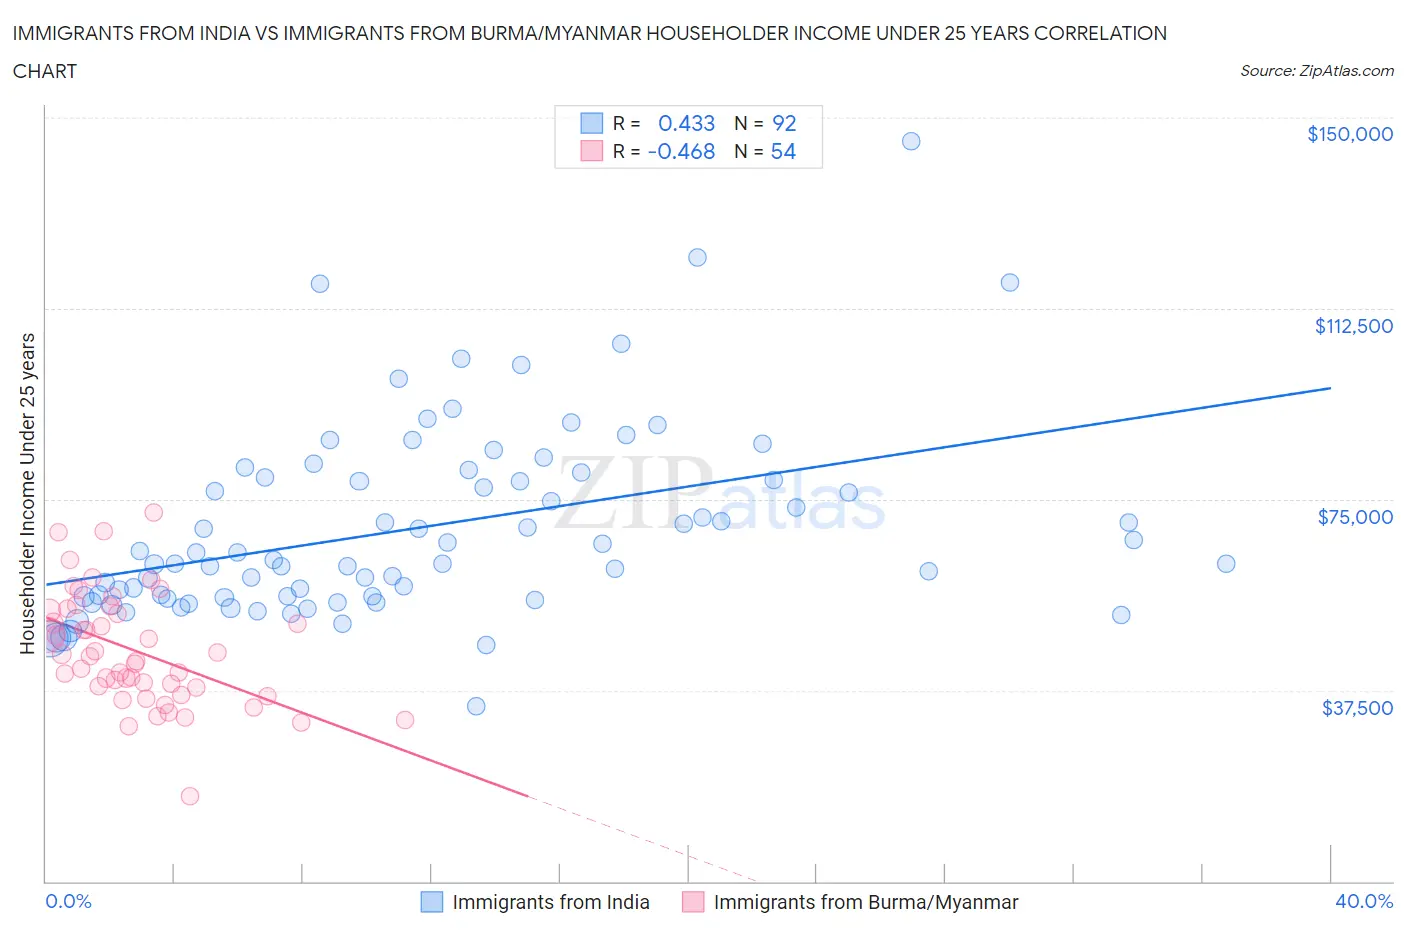
Immigrants from India vs Immigrants from Burma/Myanmar Householder Income Under 25 years Correlation Chart
The statistical analysis conducted on geographies consisting of 360,780,180 people shows a moderate positive correlation between the proportion of Immigrants from India and household income with householder under the age of 25 in the United States with a correlation coefficient (R) of 0.433 and weighted average of $59,914. Similarly, the statistical analysis conducted on geographies consisting of 158,147,131 people shows a moderate negative correlation between the proportion of Immigrants from Burma/Myanmar and household income with householder under the age of 25 in the United States with a correlation coefficient (R) of -0.468 and weighted average of $48,749, a difference of 22.9%.
Householder Income Under 25 years Correlation Summary
| Measurement | Immigrants from India | Immigrants from Burma/Myanmar |
| Minimum | $34,345 | $16,806 |
| Maximum | $145,332 | $72,545 |
| Range | $110,987 | $55,739 |
| Mean | $69,322 | $45,291 |
| Median | $62,815 | $43,645 |
| Interquartile 25% (IQ1) | $55,857 | $37,955 |
| Interquartile 75% (IQ3) | $79,050 | $53,234 |
| Interquartile Range (IQR) | $23,193 | $15,279 |
| Standard Deviation (Sample) | $18,891 | $11,040 |
| Standard Deviation (Population) | $18,788 | $10,937 |
Similar Demographics by Householder Income Under 25 years
Demographics Similar to Immigrants from India by Householder Income Under 25 years
In terms of householder income under 25 years, the demographic groups most similar to Immigrants from India are Immigrants from Taiwan ($59,424, a difference of 0.82%), Immigrants from Bolivia ($59,389, a difference of 0.88%), Thai ($59,187, a difference of 1.2%), Bolivian ($58,506, a difference of 2.4%), and Indian (Asian) ($58,239, a difference of 2.9%).
| Demographics | Rating | Rank | Householder Income Under 25 years |
| Assyrians/Chaldeans/Syriacs | 100.0 /100 | #1 | Exceptional $65,329 |
| Immigrants | Hong Kong | 100.0 /100 | #2 | Exceptional $62,083 |
| Immigrants | India | 100.0 /100 | #3 | Exceptional $59,914 |
| Immigrants | Taiwan | 100.0 /100 | #4 | Exceptional $59,424 |
| Immigrants | Bolivia | 100.0 /100 | #5 | Exceptional $59,389 |
| Thais | 100.0 /100 | #6 | Exceptional $59,187 |
| Bolivians | 100.0 /100 | #7 | Exceptional $58,506 |
| Indians (Asian) | 100.0 /100 | #8 | Exceptional $58,239 |
| Chinese | 100.0 /100 | #9 | Exceptional $58,162 |
| Afghans | 100.0 /100 | #10 | Exceptional $58,019 |
| Immigrants | China | 100.0 /100 | #11 | Exceptional $57,931 |
| Immigrants | Philippines | 100.0 /100 | #12 | Exceptional $57,930 |
| Immigrants | South Central Asia | 100.0 /100 | #13 | Exceptional $57,818 |
| Filipinos | 100.0 /100 | #14 | Exceptional $57,740 |
| Koreans | 100.0 /100 | #15 | Exceptional $57,730 |
Demographics Similar to Immigrants from Burma/Myanmar by Householder Income Under 25 years
In terms of householder income under 25 years, the demographic groups most similar to Immigrants from Burma/Myanmar are Shoshone ($48,720, a difference of 0.060%), Subsaharan African ($48,691, a difference of 0.12%), Somali ($48,657, a difference of 0.19%), Central American Indian ($48,643, a difference of 0.22%), and American ($48,860, a difference of 0.23%).
| Demographics | Rating | Rank | Householder Income Under 25 years |
| Carpatho Rusyns | 0.1 /100 | #284 | Tragic $49,113 |
| Scotch-Irish | 0.0 /100 | #285 | Tragic $49,039 |
| French American Indians | 0.0 /100 | #286 | Tragic $48,977 |
| Senegalese | 0.0 /100 | #287 | Tragic $48,953 |
| Liberians | 0.0 /100 | #288 | Tragic $48,917 |
| Hondurans | 0.0 /100 | #289 | Tragic $48,885 |
| Americans | 0.0 /100 | #290 | Tragic $48,860 |
| Immigrants | Burma/Myanmar | 0.0 /100 | #291 | Tragic $48,749 |
| Shoshone | 0.0 /100 | #292 | Tragic $48,720 |
| Sub-Saharan Africans | 0.0 /100 | #293 | Tragic $48,691 |
| Somalis | 0.0 /100 | #294 | Tragic $48,657 |
| Central American Indians | 0.0 /100 | #295 | Tragic $48,643 |
| Blackfeet | 0.0 /100 | #296 | Tragic $48,603 |
| Cree | 0.0 /100 | #297 | Tragic $48,514 |
| Yaqui | 0.0 /100 | #298 | Tragic $48,300 |