Alsatian vs Immigrants from Burma/Myanmar Householder Income Under 25 years
COMPARE
Alsatian
Immigrants from Burma/Myanmar
Householder Income Under 25 years
Householder Income Under 25 years Comparison
Alsatians
Immigrants from Burma/Myanmar
$49,267
HOUSEHOLDER INCOME UNDER 25 YEARS
0.1/ 100
METRIC RATING
282nd/ 347
METRIC RANK
$48,749
HOUSEHOLDER INCOME UNDER 25 YEARS
0.0/ 100
METRIC RATING
291st/ 347
METRIC RANK
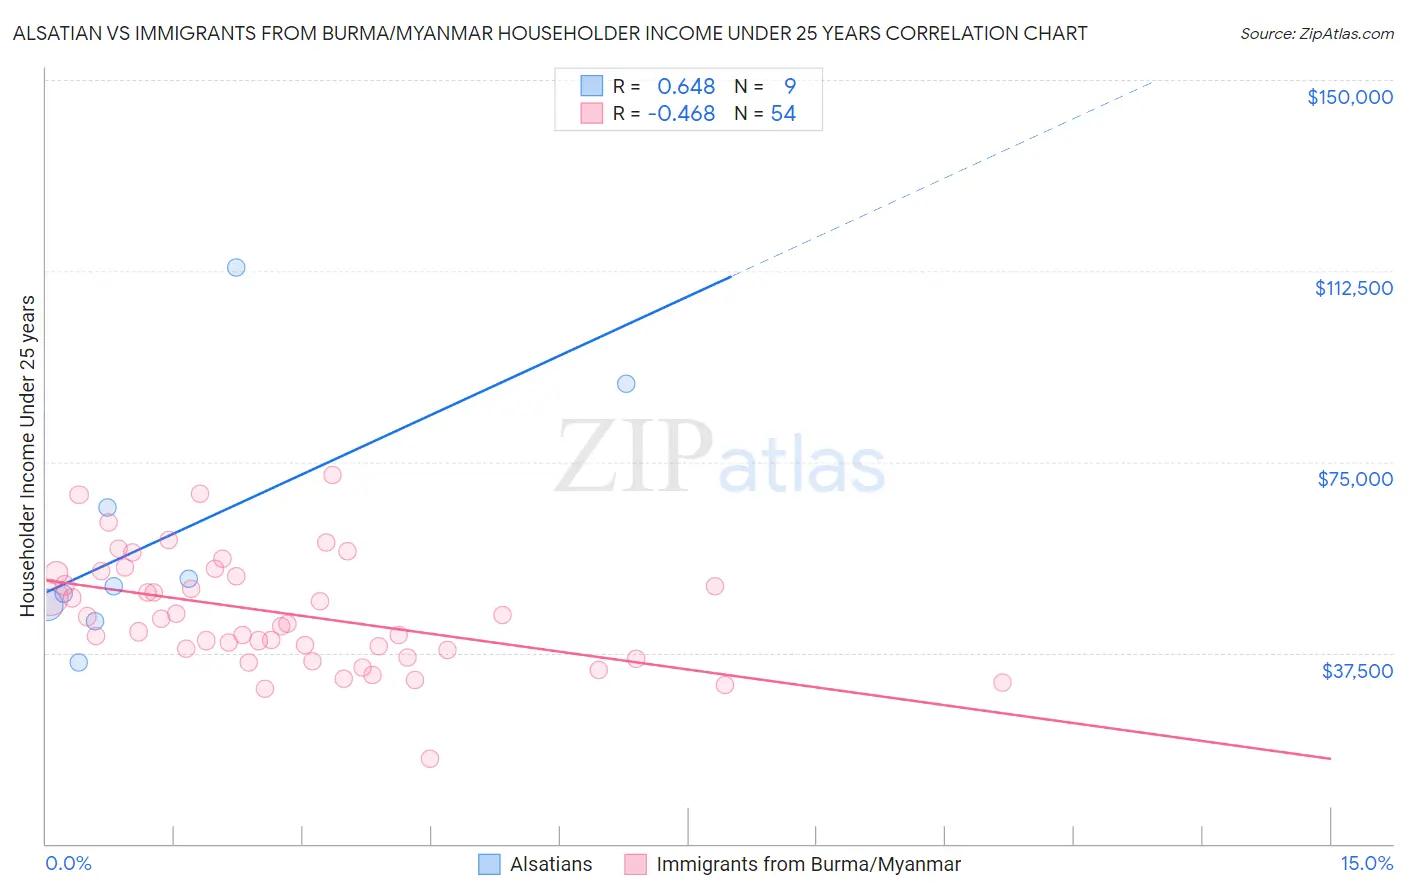
Alsatian vs Immigrants from Burma/Myanmar Householder Income Under 25 years Correlation Chart
The statistical analysis conducted on geographies consisting of 77,564,981 people shows a significant positive correlation between the proportion of Alsatians and household income with householder under the age of 25 in the United States with a correlation coefficient (R) of 0.648 and weighted average of $49,267. Similarly, the statistical analysis conducted on geographies consisting of 158,147,131 people shows a moderate negative correlation between the proportion of Immigrants from Burma/Myanmar and household income with householder under the age of 25 in the United States with a correlation coefficient (R) of -0.468 and weighted average of $48,749, a difference of 1.1%.
Householder Income Under 25 years Correlation Summary
| Measurement | Alsatian | Immigrants from Burma/Myanmar |
| Minimum | $35,598 | $16,806 |
| Maximum | $113,281 | $72,545 |
| Range | $77,683 | $55,739 |
| Mean | $60,844 | $45,291 |
| Median | $50,662 | $43,645 |
| Interquartile 25% (IQ1) | $45,251 | $37,955 |
| Interquartile 75% (IQ3) | $78,194 | $53,234 |
| Interquartile Range (IQR) | $32,943 | $15,279 |
| Standard Deviation (Sample) | $25,229 | $11,040 |
| Standard Deviation (Population) | $23,786 | $10,937 |
Demographics Similar to Alsatians and Immigrants from Burma/Myanmar by Householder Income Under 25 years
In terms of householder income under 25 years, the demographic groups most similar to Alsatians are Nonimmigrants ($49,348, a difference of 0.16%), Immigrants from Nigeria ($49,174, a difference of 0.19%), Hmong ($49,364, a difference of 0.20%), Apache ($49,395, a difference of 0.26%), and Nigerian ($49,416, a difference of 0.30%). Similarly, the demographic groups most similar to Immigrants from Burma/Myanmar are Shoshone ($48,720, a difference of 0.060%), Subsaharan African ($48,691, a difference of 0.12%), Somali ($48,657, a difference of 0.19%), Central American Indian ($48,643, a difference of 0.22%), and American ($48,860, a difference of 0.23%).
| Demographics | Rating | Rank | Householder Income Under 25 years |
| Dominicans | 0.2 /100 | #276 | Tragic $49,633 |
| Immigrants | Western Africa | 0.2 /100 | #277 | Tragic $49,621 |
| Nigerians | 0.1 /100 | #278 | Tragic $49,416 |
| Apache | 0.1 /100 | #279 | Tragic $49,395 |
| Hmong | 0.1 /100 | #280 | Tragic $49,364 |
| Immigrants | Nonimmigrants | 0.1 /100 | #281 | Tragic $49,348 |
| Alsatians | 0.1 /100 | #282 | Tragic $49,267 |
| Immigrants | Nigeria | 0.1 /100 | #283 | Tragic $49,174 |
| Carpatho Rusyns | 0.1 /100 | #284 | Tragic $49,113 |
| Scotch-Irish | 0.0 /100 | #285 | Tragic $49,039 |
| French American Indians | 0.0 /100 | #286 | Tragic $48,977 |
| Senegalese | 0.0 /100 | #287 | Tragic $48,953 |
| Liberians | 0.0 /100 | #288 | Tragic $48,917 |
| Hondurans | 0.0 /100 | #289 | Tragic $48,885 |
| Americans | 0.0 /100 | #290 | Tragic $48,860 |
| Immigrants | Burma/Myanmar | 0.0 /100 | #291 | Tragic $48,749 |
| Shoshone | 0.0 /100 | #292 | Tragic $48,720 |
| Sub-Saharan Africans | 0.0 /100 | #293 | Tragic $48,691 |
| Somalis | 0.0 /100 | #294 | Tragic $48,657 |
| Central American Indians | 0.0 /100 | #295 | Tragic $48,643 |
| Blackfeet | 0.0 /100 | #296 | Tragic $48,603 |