Immigrants from Hong Kong vs Laotian Wage/Income Gap
COMPARE
Immigrants from Hong Kong
Laotian
Wage/Income Gap
Wage/Income Gap Comparison
Immigrants from Hong Kong
Laotians
25.5%
WAGE/INCOME GAP
64.0/ 100
METRIC RATING
165th/ 347
METRIC RANK
26.4%
WAGE/INCOME GAP
19.2/ 100
METRIC RATING
202nd/ 347
METRIC RANK
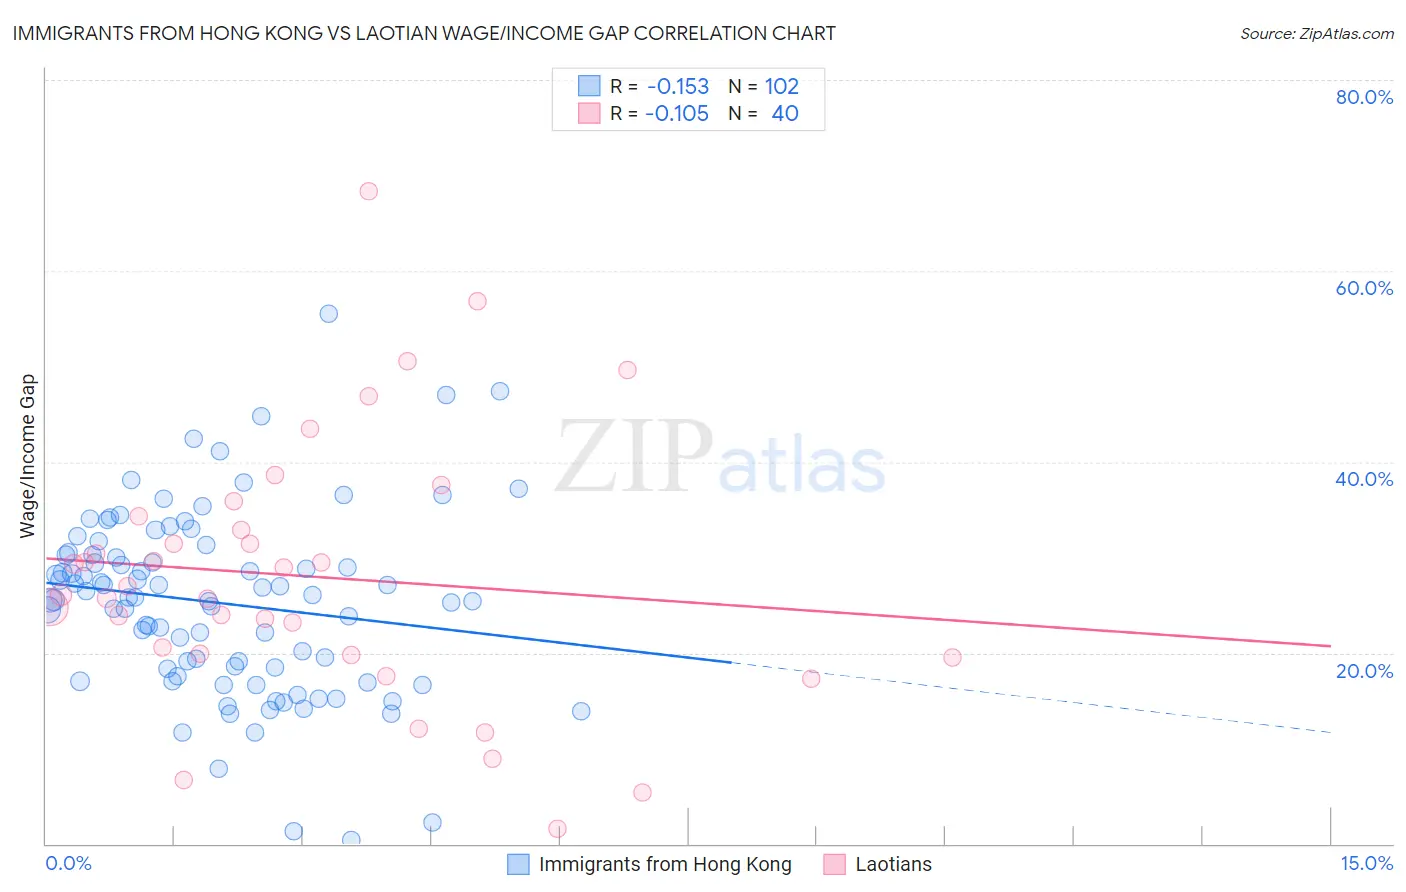
Immigrants from Hong Kong vs Laotian Wage/Income Gap Correlation Chart
The statistical analysis conducted on geographies consisting of 253,936,651 people shows a poor negative correlation between the proportion of Immigrants from Hong Kong and wage/income gap percentage in the United States with a correlation coefficient (R) of -0.153 and weighted average of 25.5%. Similarly, the statistical analysis conducted on geographies consisting of 224,802,355 people shows a poor negative correlation between the proportion of Laotians and wage/income gap percentage in the United States with a correlation coefficient (R) of -0.105 and weighted average of 26.4%, a difference of 3.3%.
Wage/Income Gap Correlation Summary
| Measurement | Immigrants from Hong Kong | Laotian |
| Minimum | 0.36% | 1.6% |
| Maximum | 55.6% | 68.3% |
| Range | 55.2% | 66.8% |
| Mean | 25.2% | 28.0% |
| Median | 25.8% | 26.5% |
| Interquartile 25% (IQ1) | 18.3% | 19.9% |
| Interquartile 75% (IQ3) | 30.3% | 33.6% |
| Interquartile Range (IQR) | 11.9% | 13.7% |
| Standard Deviation (Sample) | 9.6% | 13.9% |
| Standard Deviation (Population) | 9.6% | 13.7% |
Similar Demographics by Wage/Income Gap
Demographics Similar to Immigrants from Hong Kong by Wage/Income Gap
In terms of wage/income gap, the demographic groups most similar to Immigrants from Hong Kong are Immigrants from Ukraine (25.5%, a difference of 0.010%), Paiute (25.5%, a difference of 0.070%), Seminole (25.6%, a difference of 0.090%), Peruvian (25.6%, a difference of 0.27%), and Korean (25.4%, a difference of 0.34%).
| Demographics | Rating | Rank | Wage/Income Gap |
| Immigrants | Zimbabwe | 73.7 /100 | #158 | Good 25.3% |
| Puget Sound Salish | 73.0 /100 | #159 | Good 25.3% |
| French American Indians | 72.5 /100 | #160 | Good 25.4% |
| Albanians | 69.4 /100 | #161 | Good 25.4% |
| Shoshone | 69.0 /100 | #162 | Good 25.4% |
| Native Hawaiians | 69.0 /100 | #163 | Good 25.4% |
| Koreans | 68.6 /100 | #164 | Good 25.4% |
| Immigrants | Hong Kong | 64.0 /100 | #165 | Good 25.5% |
| Immigrants | Ukraine | 63.8 /100 | #166 | Good 25.5% |
| Paiute | 62.9 /100 | #167 | Good 25.5% |
| Seminole | 62.6 /100 | #168 | Good 25.6% |
| Peruvians | 60.1 /100 | #169 | Good 25.6% |
| Immigrants | Oceania | 57.5 /100 | #170 | Average 25.6% |
| Immigrants | Greece | 56.6 /100 | #171 | Average 25.7% |
| Immigrants | Chile | 53.2 /100 | #172 | Average 25.7% |
Demographics Similar to Laotians by Wage/Income Gap
In terms of wage/income gap, the demographic groups most similar to Laotians are Immigrants from Eastern Europe (26.4%, a difference of 0.0%), Immigrants from Syria (26.4%, a difference of 0.010%), Immigrants from Russia (26.4%, a difference of 0.020%), Delaware (26.3%, a difference of 0.17%), and Dutch West Indian (26.3%, a difference of 0.18%).
| Demographics | Rating | Rank | Wage/Income Gap |
| Immigrants | Malaysia | 22.2 /100 | #195 | Fair 26.3% |
| Immigrants | Western Asia | 21.7 /100 | #196 | Fair 26.3% |
| Zimbabweans | 21.6 /100 | #197 | Fair 26.3% |
| Venezuelans | 21.5 /100 | #198 | Fair 26.3% |
| Dutch West Indians | 21.0 /100 | #199 | Fair 26.3% |
| Delaware | 20.9 /100 | #200 | Fair 26.3% |
| Immigrants | Syria | 19.3 /100 | #201 | Poor 26.4% |
| Laotians | 19.2 /100 | #202 | Poor 26.4% |
| Immigrants | Eastern Europe | 19.2 /100 | #203 | Poor 26.4% |
| Immigrants | Russia | 19.0 /100 | #204 | Poor 26.4% |
| Immigrants | Southern Europe | 17.3 /100 | #205 | Poor 26.4% |
| Indians (Asian) | 16.5 /100 | #206 | Poor 26.4% |
| Immigrants | Italy | 15.8 /100 | #207 | Poor 26.5% |
| Egyptians | 12.7 /100 | #208 | Poor 26.6% |
| Immigrants | Kuwait | 12.6 /100 | #209 | Poor 26.6% |