Immigrants from Guyana vs Immigrants from West Indies Median Household Income
COMPARE
Immigrants from Guyana
Immigrants from West Indies
Median Household Income
Median Household Income Comparison
Immigrants from Guyana
Immigrants from West Indies
$80,324
MEDIAN HOUSEHOLD INCOME
4.5/ 100
METRIC RATING
235th/ 347
METRIC RANK
$77,956
MEDIAN HOUSEHOLD INCOME
1.0/ 100
METRIC RATING
252nd/ 347
METRIC RANK
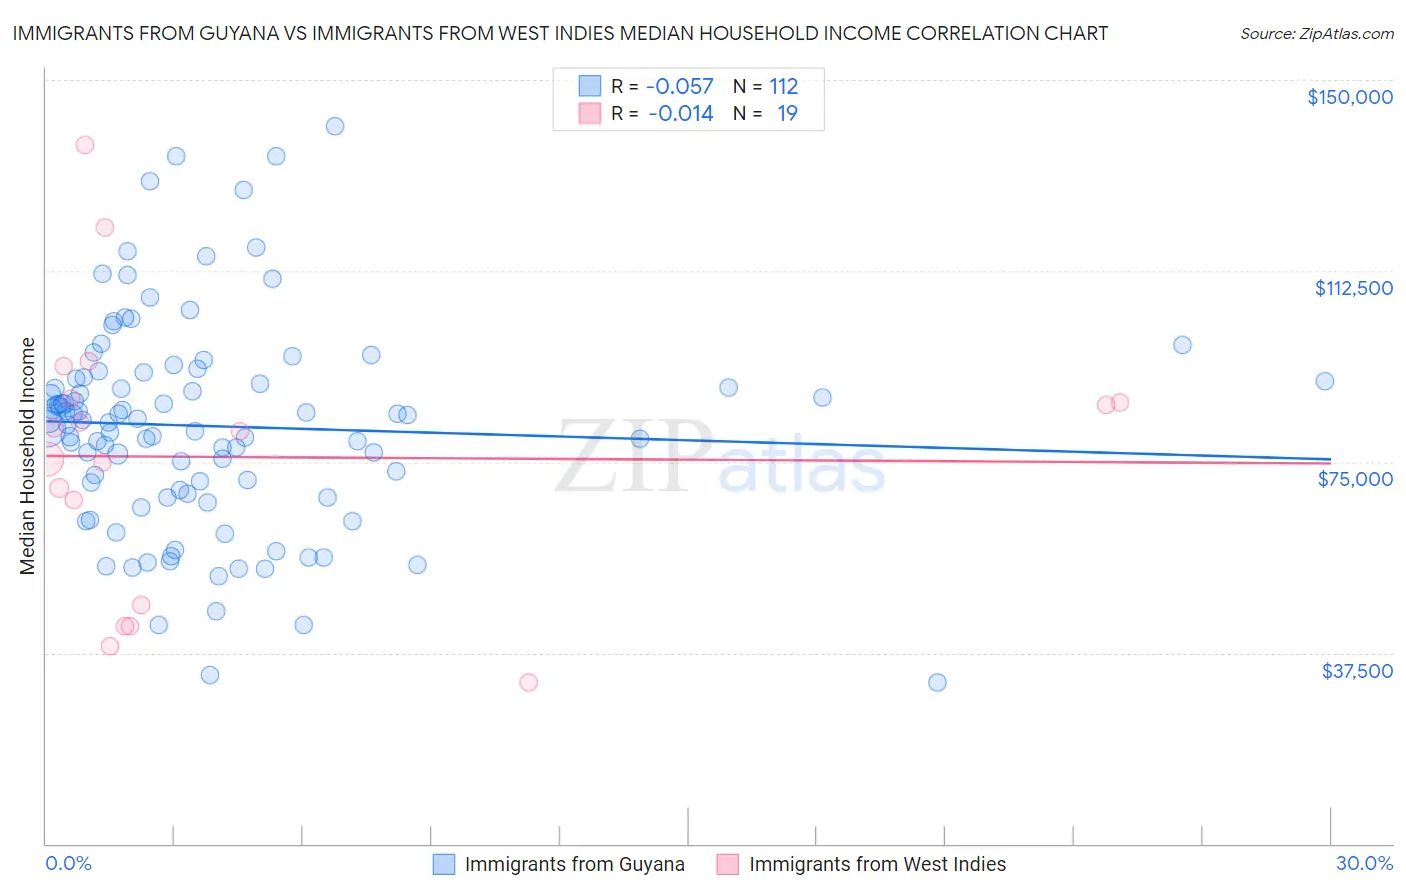
Immigrants from Guyana vs Immigrants from West Indies Median Household Income Correlation Chart
The statistical analysis conducted on geographies consisting of 183,660,864 people shows a slight negative correlation between the proportion of Immigrants from Guyana and median household income in the United States with a correlation coefficient (R) of -0.057 and weighted average of $80,324. Similarly, the statistical analysis conducted on geographies consisting of 72,454,628 people shows no correlation between the proportion of Immigrants from West Indies and median household income in the United States with a correlation coefficient (R) of -0.014 and weighted average of $77,956, a difference of 3.0%.
Median Household Income Correlation Summary
| Measurement | Immigrants from Guyana | Immigrants from West Indies |
| Minimum | $31,571 | $31,731 |
| Maximum | $140,893 | $137,182 |
| Range | $109,322 | $105,451 |
| Mean | $81,995 | $75,944 |
| Median | $83,283 | $81,103 |
| Interquartile 25% (IQ1) | $69,032 | $46,875 |
| Interquartile 75% (IQ3) | $91,451 | $87,404 |
| Interquartile Range (IQR) | $22,418 | $40,529 |
| Standard Deviation (Sample) | $20,739 | $27,297 |
| Standard Deviation (Population) | $20,646 | $26,569 |
Demographics Similar to Immigrants from Guyana and Immigrants from West Indies by Median Household Income
In terms of median household income, the demographic groups most similar to Immigrants from Guyana are Immigrants from Ecuador ($80,341, a difference of 0.020%), Immigrants from the Azores ($80,357, a difference of 0.040%), Immigrants from Bosnia and Herzegovina ($79,888, a difference of 0.55%), Nicaraguan ($79,737, a difference of 0.74%), and Barbadian ($79,664, a difference of 0.83%). Similarly, the demographic groups most similar to Immigrants from West Indies are Mexican American Indian ($78,166, a difference of 0.27%), Immigrants from St. Vincent and the Grenadines ($77,690, a difference of 0.34%), Immigrants from Laos ($78,327, a difference of 0.48%), West Indian ($78,455, a difference of 0.64%), and Sudanese ($78,529, a difference of 0.74%).
| Demographics | Rating | Rank | Median Household Income |
| Immigrants | Azores | 4.5 /100 | #233 | Tragic $80,357 |
| Immigrants | Ecuador | 4.5 /100 | #234 | Tragic $80,341 |
| Immigrants | Guyana | 4.5 /100 | #235 | Tragic $80,324 |
| Immigrants | Bosnia and Herzegovina | 3.4 /100 | #236 | Tragic $79,888 |
| Nicaraguans | 3.1 /100 | #237 | Tragic $79,737 |
| Barbadians | 3.0 /100 | #238 | Tragic $79,664 |
| Alaska Natives | 2.7 /100 | #239 | Tragic $79,509 |
| Immigrants | Western Africa | 2.7 /100 | #240 | Tragic $79,490 |
| Immigrants | Nonimmigrants | 2.6 /100 | #241 | Tragic $79,429 |
| Immigrants | Sudan | 2.1 /100 | #242 | Tragic $79,103 |
| Immigrants | Barbados | 1.9 /100 | #243 | Tragic $78,989 |
| Marshallese | 1.9 /100 | #244 | Tragic $78,930 |
| Inupiat | 1.8 /100 | #245 | Tragic $78,841 |
| Central Americans | 1.7 /100 | #246 | Tragic $78,803 |
| Immigrants | Burma/Myanmar | 1.6 /100 | #247 | Tragic $78,682 |
| Sudanese | 1.5 /100 | #248 | Tragic $78,529 |
| West Indians | 1.4 /100 | #249 | Tragic $78,455 |
| Immigrants | Laos | 1.3 /100 | #250 | Tragic $78,327 |
| Mexican American Indians | 1.2 /100 | #251 | Tragic $78,166 |
| Immigrants | West Indies | 1.0 /100 | #252 | Tragic $77,956 |
| Immigrants | St. Vincent and the Grenadines | 0.9 /100 | #253 | Tragic $77,690 |