Immigrants from England vs Immigrants from St. Vincent and the Grenadines Householder Income Ages 25 - 44 years
COMPARE
Immigrants from England
Immigrants from St. Vincent and the Grenadines
Householder Income Ages 25 - 44 years
Householder Income Ages 25 - 44 years Comparison
Immigrants from England
Immigrants from St. Vincent and the Grenadines
$102,020
HOUSEHOLDER INCOME AGES 25 - 44 YEARS
98.4/ 100
METRIC RATING
93rd/ 347
METRIC RANK
$88,888
HOUSEHOLDER INCOME AGES 25 - 44 YEARS
4.1/ 100
METRIC RATING
227th/ 347
METRIC RANK
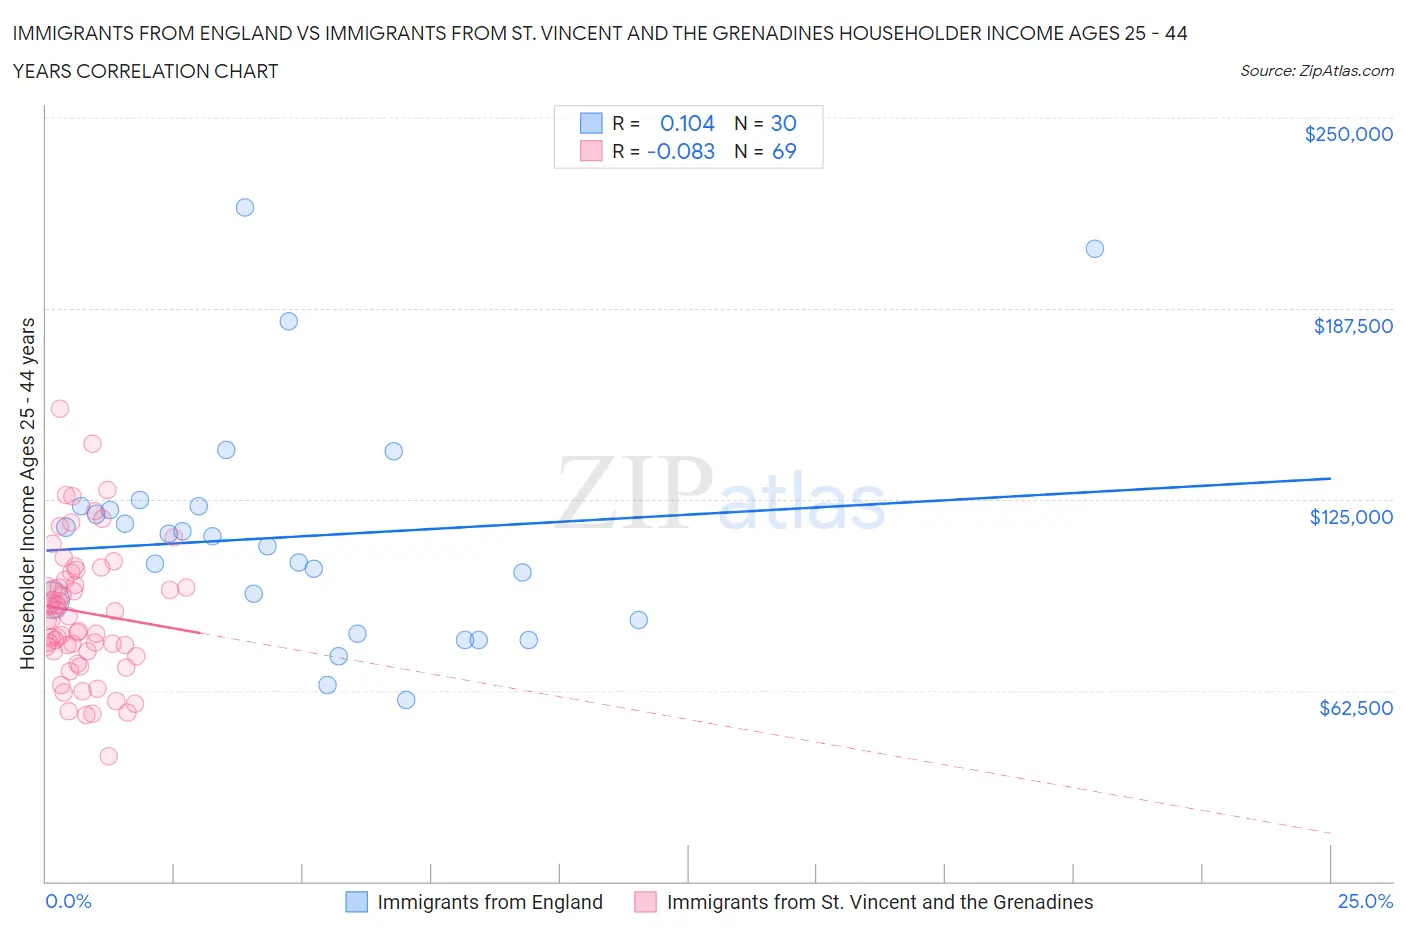
Immigrants from England vs Immigrants from St. Vincent and the Grenadines Householder Income Ages 25 - 44 years Correlation Chart
The statistical analysis conducted on geographies consisting of 390,728,278 people shows a poor positive correlation between the proportion of Immigrants from England and household income with householder between the ages 25 and 44 in the United States with a correlation coefficient (R) of 0.104 and weighted average of $102,020. Similarly, the statistical analysis conducted on geographies consisting of 56,178,565 people shows a slight negative correlation between the proportion of Immigrants from St. Vincent and the Grenadines and household income with householder between the ages 25 and 44 in the United States with a correlation coefficient (R) of -0.083 and weighted average of $88,888, a difference of 14.8%.
Householder Income Ages 25 - 44 years Correlation Summary
| Measurement | Immigrants from England | Immigrants from St. Vincent and the Grenadines |
| Minimum | $59,375 | $40,942 |
| Maximum | $220,451 | $154,470 |
| Range | $161,076 | $113,528 |
| Mean | $112,915 | $88,106 |
| Median | $111,398 | $86,685 |
| Interquartile 25% (IQ1) | $85,313 | $75,335 |
| Interquartile 75% (IQ3) | $122,883 | $99,794 |
| Interquartile Range (IQR) | $37,570 | $24,459 |
| Standard Deviation (Sample) | $37,421 | $21,933 |
| Standard Deviation (Population) | $36,792 | $21,773 |
Similar Demographics by Householder Income Ages 25 - 44 years
Demographics Similar to Immigrants from England by Householder Income Ages 25 - 44 years
In terms of householder income ages 25 - 44 years, the demographic groups most similar to Immigrants from England are Sri Lankan ($101,960, a difference of 0.060%), Assyrian/Chaldean/Syriac ($101,936, a difference of 0.080%), Macedonian ($101,882, a difference of 0.14%), Austrian ($101,842, a difference of 0.17%), and Immigrants from Kazakhstan ($101,727, a difference of 0.29%).
| Demographics | Rating | Rank | Householder Income Ages 25 - 44 years |
| Immigrants | Hungary | 98.9 /100 | #86 | Exceptional $102,655 |
| Immigrants | Western Europe | 98.9 /100 | #87 | Exceptional $102,654 |
| Immigrants | Canada | 98.9 /100 | #88 | Exceptional $102,616 |
| Romanians | 98.8 /100 | #89 | Exceptional $102,544 |
| Ukrainians | 98.8 /100 | #90 | Exceptional $102,451 |
| Croatians | 98.7 /100 | #91 | Exceptional $102,414 |
| Immigrants | North America | 98.7 /100 | #92 | Exceptional $102,407 |
| Immigrants | England | 98.4 /100 | #93 | Exceptional $102,020 |
| Sri Lankans | 98.4 /100 | #94 | Exceptional $101,960 |
| Assyrians/Chaldeans/Syriacs | 98.3 /100 | #95 | Exceptional $101,936 |
| Macedonians | 98.3 /100 | #96 | Exceptional $101,882 |
| Austrians | 98.3 /100 | #97 | Exceptional $101,842 |
| Immigrants | Kazakhstan | 98.1 /100 | #98 | Exceptional $101,727 |
| Taiwanese | 97.9 /100 | #99 | Exceptional $101,492 |
| Immigrants | Argentina | 97.8 /100 | #100 | Exceptional $101,415 |
Demographics Similar to Immigrants from St. Vincent and the Grenadines by Householder Income Ages 25 - 44 years
In terms of householder income ages 25 - 44 years, the demographic groups most similar to Immigrants from St. Vincent and the Grenadines are Immigrants from Bosnia and Herzegovina ($88,819, a difference of 0.080%), Immigrants from Barbados ($88,687, a difference of 0.23%), Alaskan Athabascan ($88,446, a difference of 0.50%), Immigrants from Iraq ($89,444, a difference of 0.62%), and Immigrants from Panama ($89,451, a difference of 0.63%).
| Demographics | Rating | Rank | Householder Income Ages 25 - 44 years |
| Trinidadians and Tobagonians | 6.8 /100 | #220 | Tragic $89,856 |
| Immigrants | Trinidad and Tobago | 6.5 /100 | #221 | Tragic $89,748 |
| Immigrants | Ecuador | 6.2 /100 | #222 | Tragic $89,673 |
| Immigrants | Guyana | 5.9 /100 | #223 | Tragic $89,586 |
| Barbadians | 5.9 /100 | #224 | Tragic $89,565 |
| Immigrants | Panama | 5.5 /100 | #225 | Tragic $89,451 |
| Immigrants | Iraq | 5.5 /100 | #226 | Tragic $89,444 |
| Immigrants | St. Vincent and the Grenadines | 4.1 /100 | #227 | Tragic $88,888 |
| Immigrants | Bosnia and Herzegovina | 4.0 /100 | #228 | Tragic $88,819 |
| Immigrants | Barbados | 3.7 /100 | #229 | Tragic $88,687 |
| Alaskan Athabascans | 3.3 /100 | #230 | Tragic $88,446 |
| Immigrants | Grenada | 3.0 /100 | #231 | Tragic $88,311 |
| Immigrants | Nonimmigrants | 3.0 /100 | #232 | Tragic $88,301 |
| Malaysians | 3.0 /100 | #233 | Tragic $88,291 |
| Venezuelans | 2.9 /100 | #234 | Tragic $88,232 |