Immigrants from England vs Ghanaian Householder Income Ages 25 - 44 years
COMPARE
Immigrants from England
Ghanaian
Householder Income Ages 25 - 44 years
Householder Income Ages 25 - 44 years Comparison
Immigrants from England
Ghanaians
$102,020
HOUSEHOLDER INCOME AGES 25 - 44 YEARS
98.4/ 100
METRIC RATING
93rd/ 347
METRIC RANK
$90,137
HOUSEHOLDER INCOME AGES 25 - 44 YEARS
7.9/ 100
METRIC RATING
216th/ 347
METRIC RANK
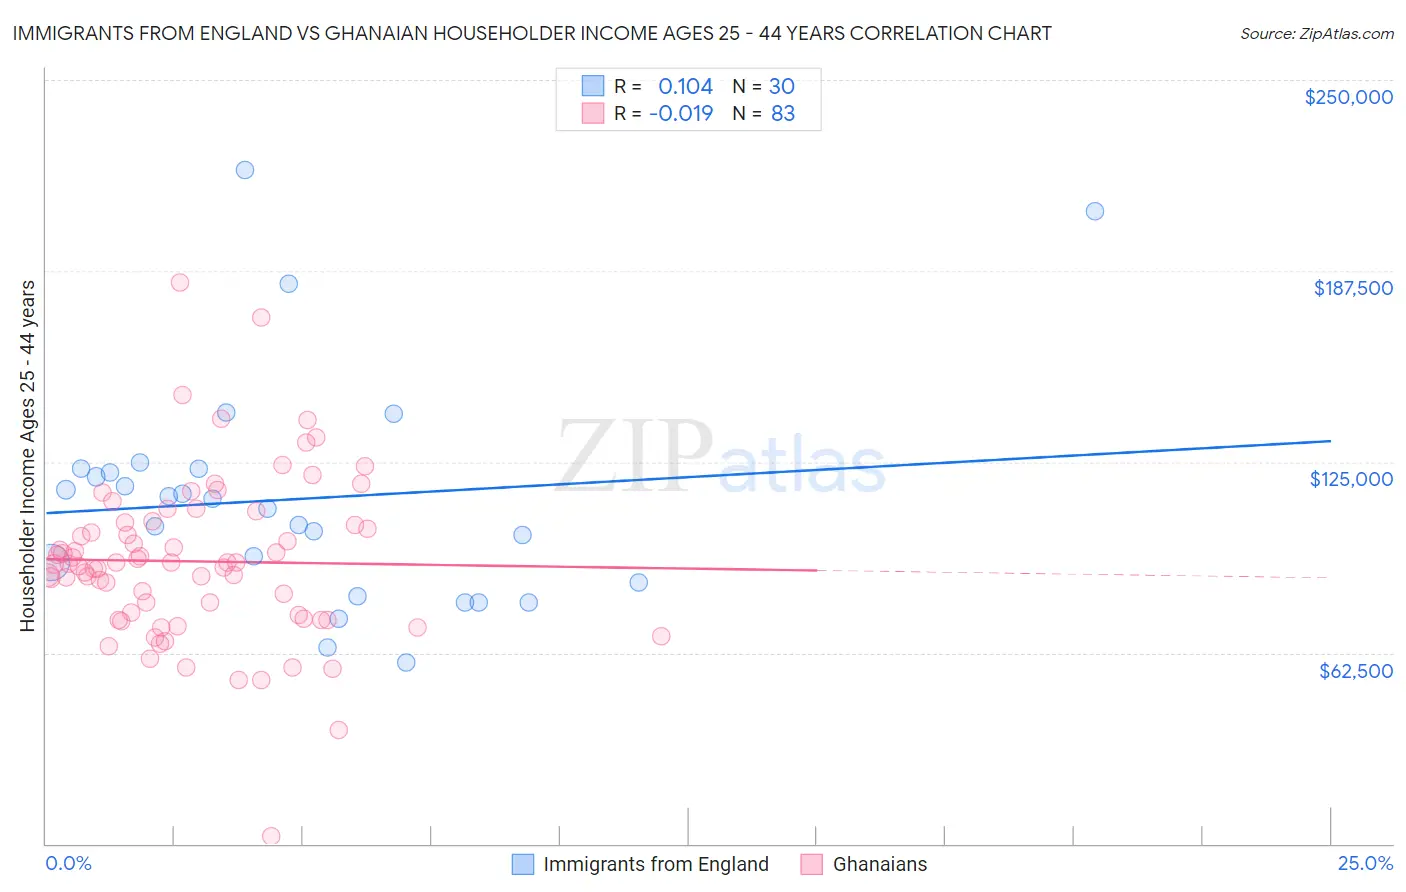
Immigrants from England vs Ghanaian Householder Income Ages 25 - 44 years Correlation Chart
The statistical analysis conducted on geographies consisting of 390,728,278 people shows a poor positive correlation between the proportion of Immigrants from England and household income with householder between the ages 25 and 44 in the United States with a correlation coefficient (R) of 0.104 and weighted average of $102,020. Similarly, the statistical analysis conducted on geographies consisting of 190,400,180 people shows no correlation between the proportion of Ghanaians and household income with householder between the ages 25 and 44 in the United States with a correlation coefficient (R) of -0.019 and weighted average of $90,137, a difference of 13.2%.
Householder Income Ages 25 - 44 years Correlation Summary
| Measurement | Immigrants from England | Ghanaian |
| Minimum | $59,375 | $2,499 |
| Maximum | $220,451 | $183,644 |
| Range | $161,076 | $181,145 |
| Mean | $112,915 | $92,427 |
| Median | $111,398 | $91,588 |
| Interquartile 25% (IQ1) | $85,313 | $73,476 |
| Interquartile 75% (IQ3) | $122,883 | $104,966 |
| Interquartile Range (IQR) | $37,570 | $31,489 |
| Standard Deviation (Sample) | $37,421 | $27,016 |
| Standard Deviation (Population) | $36,792 | $26,853 |
Similar Demographics by Householder Income Ages 25 - 44 years
Demographics Similar to Immigrants from England by Householder Income Ages 25 - 44 years
In terms of householder income ages 25 - 44 years, the demographic groups most similar to Immigrants from England are Sri Lankan ($101,960, a difference of 0.060%), Assyrian/Chaldean/Syriac ($101,936, a difference of 0.080%), Macedonian ($101,882, a difference of 0.14%), Austrian ($101,842, a difference of 0.17%), and Immigrants from Kazakhstan ($101,727, a difference of 0.29%).
| Demographics | Rating | Rank | Householder Income Ages 25 - 44 years |
| Immigrants | Hungary | 98.9 /100 | #86 | Exceptional $102,655 |
| Immigrants | Western Europe | 98.9 /100 | #87 | Exceptional $102,654 |
| Immigrants | Canada | 98.9 /100 | #88 | Exceptional $102,616 |
| Romanians | 98.8 /100 | #89 | Exceptional $102,544 |
| Ukrainians | 98.8 /100 | #90 | Exceptional $102,451 |
| Croatians | 98.7 /100 | #91 | Exceptional $102,414 |
| Immigrants | North America | 98.7 /100 | #92 | Exceptional $102,407 |
| Immigrants | England | 98.4 /100 | #93 | Exceptional $102,020 |
| Sri Lankans | 98.4 /100 | #94 | Exceptional $101,960 |
| Assyrians/Chaldeans/Syriacs | 98.3 /100 | #95 | Exceptional $101,936 |
| Macedonians | 98.3 /100 | #96 | Exceptional $101,882 |
| Austrians | 98.3 /100 | #97 | Exceptional $101,842 |
| Immigrants | Kazakhstan | 98.1 /100 | #98 | Exceptional $101,727 |
| Taiwanese | 97.9 /100 | #99 | Exceptional $101,492 |
| Immigrants | Argentina | 97.8 /100 | #100 | Exceptional $101,415 |
Demographics Similar to Ghanaians by Householder Income Ages 25 - 44 years
In terms of householder income ages 25 - 44 years, the demographic groups most similar to Ghanaians are Panamanian ($90,193, a difference of 0.060%), Scotch-Irish ($89,969, a difference of 0.19%), Guyanese ($89,940, a difference of 0.22%), Immigrants from Africa ($90,372, a difference of 0.26%), and Delaware ($89,876, a difference of 0.29%).
| Demographics | Rating | Rank | Householder Income Ages 25 - 44 years |
| Immigrants | Uruguay | 13.2 /100 | #209 | Poor $91,171 |
| Immigrants | Kenya | 10.9 /100 | #210 | Poor $90,767 |
| Iraqis | 10.8 /100 | #211 | Poor $90,764 |
| Hawaiians | 10.6 /100 | #212 | Poor $90,722 |
| Immigrants | Bangladesh | 9.3 /100 | #213 | Tragic $90,448 |
| Immigrants | Africa | 8.9 /100 | #214 | Tragic $90,372 |
| Panamanians | 8.1 /100 | #215 | Tragic $90,193 |
| Ghanaians | 7.9 /100 | #216 | Tragic $90,137 |
| Scotch-Irish | 7.3 /100 | #217 | Tragic $89,969 |
| Guyanese | 7.1 /100 | #218 | Tragic $89,940 |
| Delaware | 6.9 /100 | #219 | Tragic $89,876 |
| Trinidadians and Tobagonians | 6.8 /100 | #220 | Tragic $89,856 |
| Immigrants | Trinidad and Tobago | 6.5 /100 | #221 | Tragic $89,748 |
| Immigrants | Ecuador | 6.2 /100 | #222 | Tragic $89,673 |
| Immigrants | Guyana | 5.9 /100 | #223 | Tragic $89,586 |