Immigrants from Cuba vs Immigrants from Guatemala Wage/Income Gap
COMPARE
Immigrants from Cuba
Immigrants from Guatemala
Wage/Income Gap
Wage/Income Gap Comparison
Immigrants from Cuba
Immigrants from Guatemala
22.4%
WAGE/INCOME GAP
100.0/ 100
METRIC RATING
58th/ 347
METRIC RANK
22.5%
WAGE/INCOME GAP
100.0/ 100
METRIC RATING
62nd/ 347
METRIC RANK
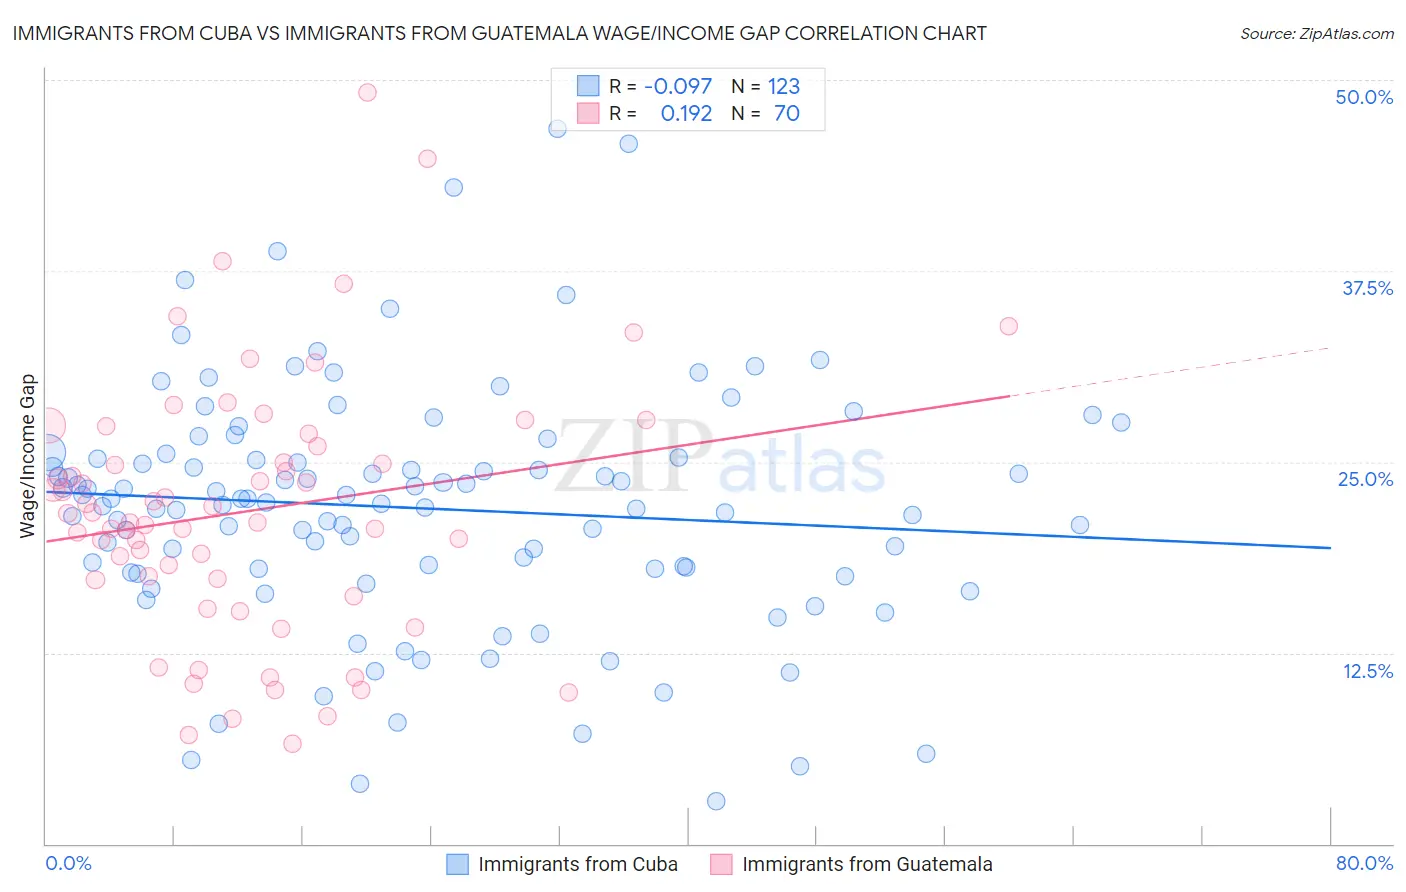
Immigrants from Cuba vs Immigrants from Guatemala Wage/Income Gap Correlation Chart
The statistical analysis conducted on geographies consisting of 325,829,876 people shows a slight negative correlation between the proportion of Immigrants from Cuba and wage/income gap percentage in the United States with a correlation coefficient (R) of -0.097 and weighted average of 22.4%. Similarly, the statistical analysis conducted on geographies consisting of 377,062,007 people shows a poor positive correlation between the proportion of Immigrants from Guatemala and wage/income gap percentage in the United States with a correlation coefficient (R) of 0.192 and weighted average of 22.5%, a difference of 0.44%.
Wage/Income Gap Correlation Summary
| Measurement | Immigrants from Cuba | Immigrants from Guatemala |
| Minimum | 2.8% | 6.6% |
| Maximum | 46.8% | 49.2% |
| Range | 44.0% | 42.6% |
| Mean | 22.0% | 21.8% |
| Median | 22.3% | 21.3% |
| Interquartile 25% (IQ1) | 18.0% | 17.3% |
| Interquartile 75% (IQ3) | 25.3% | 26.1% |
| Interquartile Range (IQR) | 7.3% | 8.8% |
| Standard Deviation (Sample) | 7.9% | 8.5% |
| Standard Deviation (Population) | 7.9% | 8.4% |
Demographics Similar to Immigrants from Cuba and Immigrants from Guatemala by Wage/Income Gap
In terms of wage/income gap, the demographic groups most similar to Immigrants from Cuba are Navajo (22.4%, a difference of 0.040%), Immigrants from Middle Africa (22.4%, a difference of 0.060%), Ghanaian (22.3%, a difference of 0.080%), Immigrants from Ghana (22.3%, a difference of 0.18%), and Immigrants from Zaire (22.3%, a difference of 0.22%). Similarly, the demographic groups most similar to Immigrants from Guatemala are Immigrants from Ecuador (22.5%, a difference of 0.14%), Immigrants from Fiji (22.4%, a difference of 0.21%), Immigrants from Middle Africa (22.4%, a difference of 0.38%), Navajo (22.4%, a difference of 0.40%), and Spanish American Indian (22.5%, a difference of 0.43%).
| Demographics | Rating | Rank | Wage/Income Gap |
| Immigrants | Western Africa | 100.0 /100 | #50 | Exceptional 22.0% |
| Tohono O'odham | 100.0 /100 | #51 | Exceptional 22.1% |
| Immigrants | Cameroon | 100.0 /100 | #52 | Exceptional 22.2% |
| Bangladeshis | 100.0 /100 | #53 | Exceptional 22.2% |
| Nepalese | 100.0 /100 | #54 | Exceptional 22.2% |
| Immigrants | Zaire | 100.0 /100 | #55 | Exceptional 22.3% |
| Immigrants | Ghana | 100.0 /100 | #56 | Exceptional 22.3% |
| Ghanaians | 100.0 /100 | #57 | Exceptional 22.3% |
| Immigrants | Cuba | 100.0 /100 | #58 | Exceptional 22.4% |
| Navajo | 100.0 /100 | #59 | Exceptional 22.4% |
| Immigrants | Middle Africa | 100.0 /100 | #60 | Exceptional 22.4% |
| Immigrants | Fiji | 100.0 /100 | #61 | Exceptional 22.4% |
| Immigrants | Guatemala | 100.0 /100 | #62 | Exceptional 22.5% |
| Immigrants | Ecuador | 100.0 /100 | #63 | Exceptional 22.5% |
| Spanish American Indians | 100.0 /100 | #64 | Exceptional 22.5% |
| Guatemalans | 99.9 /100 | #65 | Exceptional 22.6% |
| Central American Indians | 99.9 /100 | #66 | Exceptional 22.7% |
| Menominee | 99.9 /100 | #67 | Exceptional 22.7% |
| Immigrants | Nigeria | 99.9 /100 | #68 | Exceptional 22.7% |
| Indonesians | 99.9 /100 | #69 | Exceptional 22.7% |
| Immigrants | Uzbekistan | 99.9 /100 | #70 | Exceptional 22.7% |