Immigrants from Central America vs German Median Earnings
COMPARE
Immigrants from Central America
German
Median Earnings
Median Earnings Comparison
Immigrants from Central America
Germans
$39,762
MEDIAN EARNINGS
0.0/ 100
METRIC RATING
322nd/ 347
METRIC RANK
$45,935
MEDIAN EARNINGS
33.2/ 100
METRIC RATING
192nd/ 347
METRIC RANK
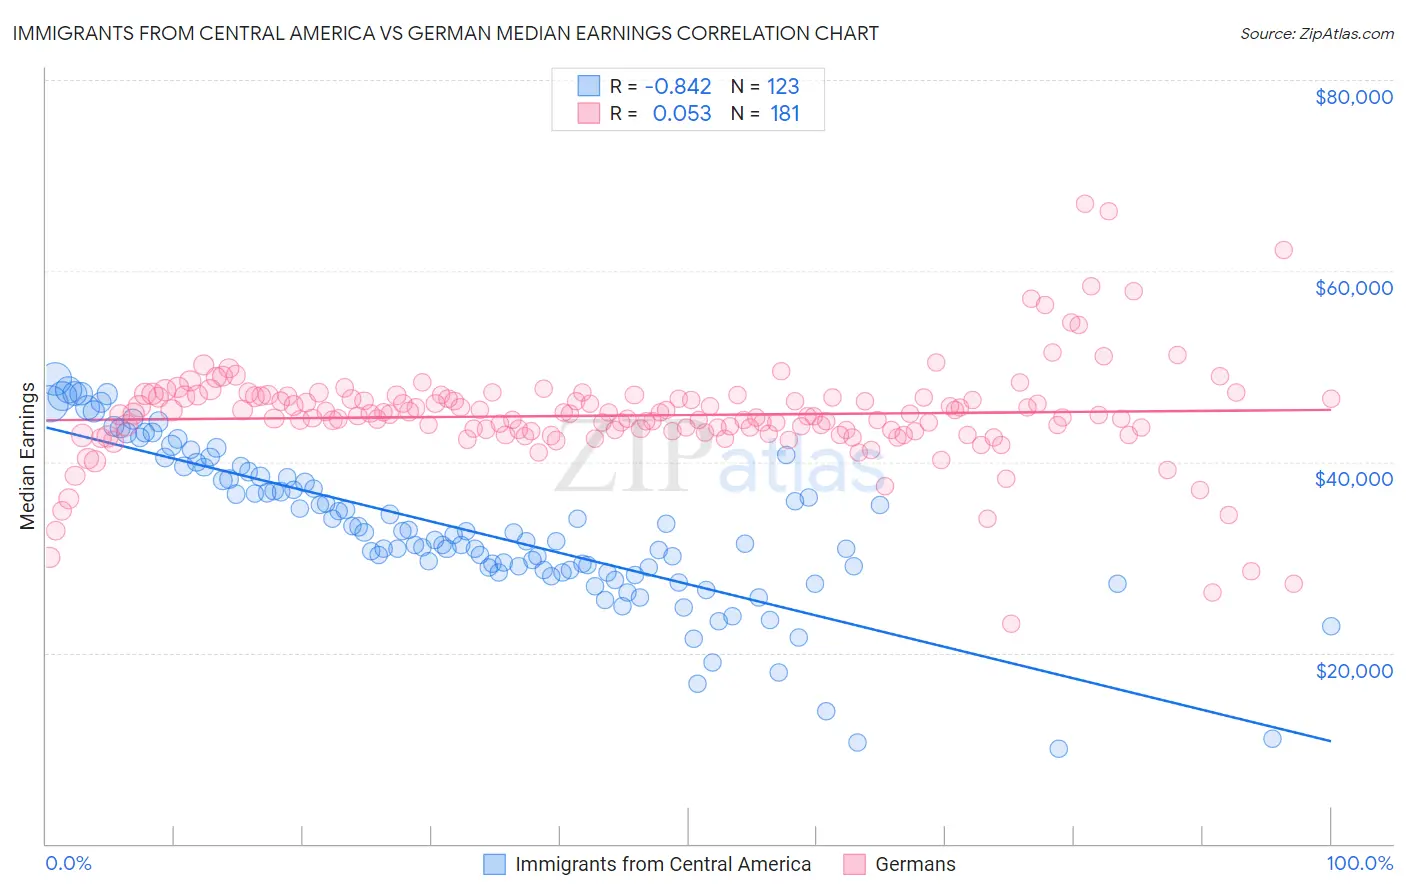
Immigrants from Central America vs German Median Earnings Correlation Chart
The statistical analysis conducted on geographies consisting of 536,322,180 people shows a very strong negative correlation between the proportion of Immigrants from Central America and median earnings in the United States with a correlation coefficient (R) of -0.842 and weighted average of $39,762. Similarly, the statistical analysis conducted on geographies consisting of 580,480,068 people shows a slight positive correlation between the proportion of Germans and median earnings in the United States with a correlation coefficient (R) of 0.053 and weighted average of $45,935, a difference of 15.5%.
Median Earnings Correlation Summary
| Measurement | Immigrants from Central America | German |
| Minimum | $9,917 | $23,082 |
| Maximum | $48,696 | $67,100 |
| Range | $38,779 | $44,018 |
| Mean | $33,043 | $44,861 |
| Median | $32,380 | $44,941 |
| Interquartile 25% (IQ1) | $28,620 | $43,214 |
| Interquartile 75% (IQ3) | $38,496 | $46,790 |
| Interquartile Range (IQR) | $9,875 | $3,576 |
| Standard Deviation (Sample) | $8,045 | $5,408 |
| Standard Deviation (Population) | $8,012 | $5,393 |
Similar Demographics by Median Earnings
Demographics Similar to Immigrants from Central America by Median Earnings
In terms of median earnings, the demographic groups most similar to Immigrants from Central America are Bahamian ($39,735, a difference of 0.070%), Ottawa ($39,721, a difference of 0.10%), Mexican ($39,834, a difference of 0.18%), Immigrants from Bahamas ($39,861, a difference of 0.25%), and Creek ($39,648, a difference of 0.29%).
| Demographics | Rating | Rank | Median Earnings |
| Seminole | 0.0 /100 | #315 | Tragic $40,233 |
| Immigrants | Honduras | 0.0 /100 | #316 | Tragic $40,195 |
| Fijians | 0.0 /100 | #317 | Tragic $40,193 |
| Dutch West Indians | 0.0 /100 | #318 | Tragic $40,107 |
| Blacks/African Americans | 0.0 /100 | #319 | Tragic $40,085 |
| Immigrants | Bahamas | 0.0 /100 | #320 | Tragic $39,861 |
| Mexicans | 0.0 /100 | #321 | Tragic $39,834 |
| Immigrants | Central America | 0.0 /100 | #322 | Tragic $39,762 |
| Bahamians | 0.0 /100 | #323 | Tragic $39,735 |
| Ottawa | 0.0 /100 | #324 | Tragic $39,721 |
| Creek | 0.0 /100 | #325 | Tragic $39,648 |
| Immigrants | Yemen | 0.0 /100 | #326 | Tragic $39,540 |
| Yuman | 0.0 /100 | #327 | Tragic $39,523 |
| Sioux | 0.0 /100 | #328 | Tragic $39,448 |
| Kiowa | 0.0 /100 | #329 | Tragic $39,232 |
Demographics Similar to Germans by Median Earnings
In terms of median earnings, the demographic groups most similar to Germans are Guamanian/Chamorro ($45,933, a difference of 0.0%), Finnish ($45,940, a difference of 0.010%), Immigrants from Costa Rica ($45,928, a difference of 0.020%), Immigrants from St. Vincent and the Grenadines ($45,908, a difference of 0.060%), and Yugoslavian ($45,846, a difference of 0.19%).
| Demographics | Rating | Rank | Median Earnings |
| Uruguayans | 41.6 /100 | #185 | Average $46,190 |
| Vietnamese | 40.9 /100 | #186 | Average $46,172 |
| Iraqis | 39.9 /100 | #187 | Fair $46,140 |
| Immigrants | Armenia | 38.3 /100 | #188 | Fair $46,094 |
| Spaniards | 37.2 /100 | #189 | Fair $46,059 |
| French Canadians | 36.1 /100 | #190 | Fair $46,026 |
| Finns | 33.4 /100 | #191 | Fair $45,940 |
| Germans | 33.2 /100 | #192 | Fair $45,935 |
| Guamanians/Chamorros | 33.2 /100 | #193 | Fair $45,933 |
| Immigrants | Costa Rica | 33.0 /100 | #194 | Fair $45,928 |
| Immigrants | St. Vincent and the Grenadines | 32.4 /100 | #195 | Fair $45,908 |
| Yugoslavians | 30.5 /100 | #196 | Fair $45,846 |
| Barbadians | 30.5 /100 | #197 | Fair $45,846 |
| Trinidadians and Tobagonians | 29.7 /100 | #198 | Fair $45,820 |
| Immigrants | Barbados | 29.6 /100 | #199 | Fair $45,816 |