Immigrants from Central America vs German Kindergarten
COMPARE
Immigrants from Central America
German
Kindergarten
Kindergarten Comparison
Immigrants from Central America
Germans
96.4%
KINDERGARTEN
0.0/ 100
METRIC RATING
340th/ 347
METRIC RANK
98.7%
KINDERGARTEN
100.0/ 100
METRIC RATING
11th/ 347
METRIC RANK
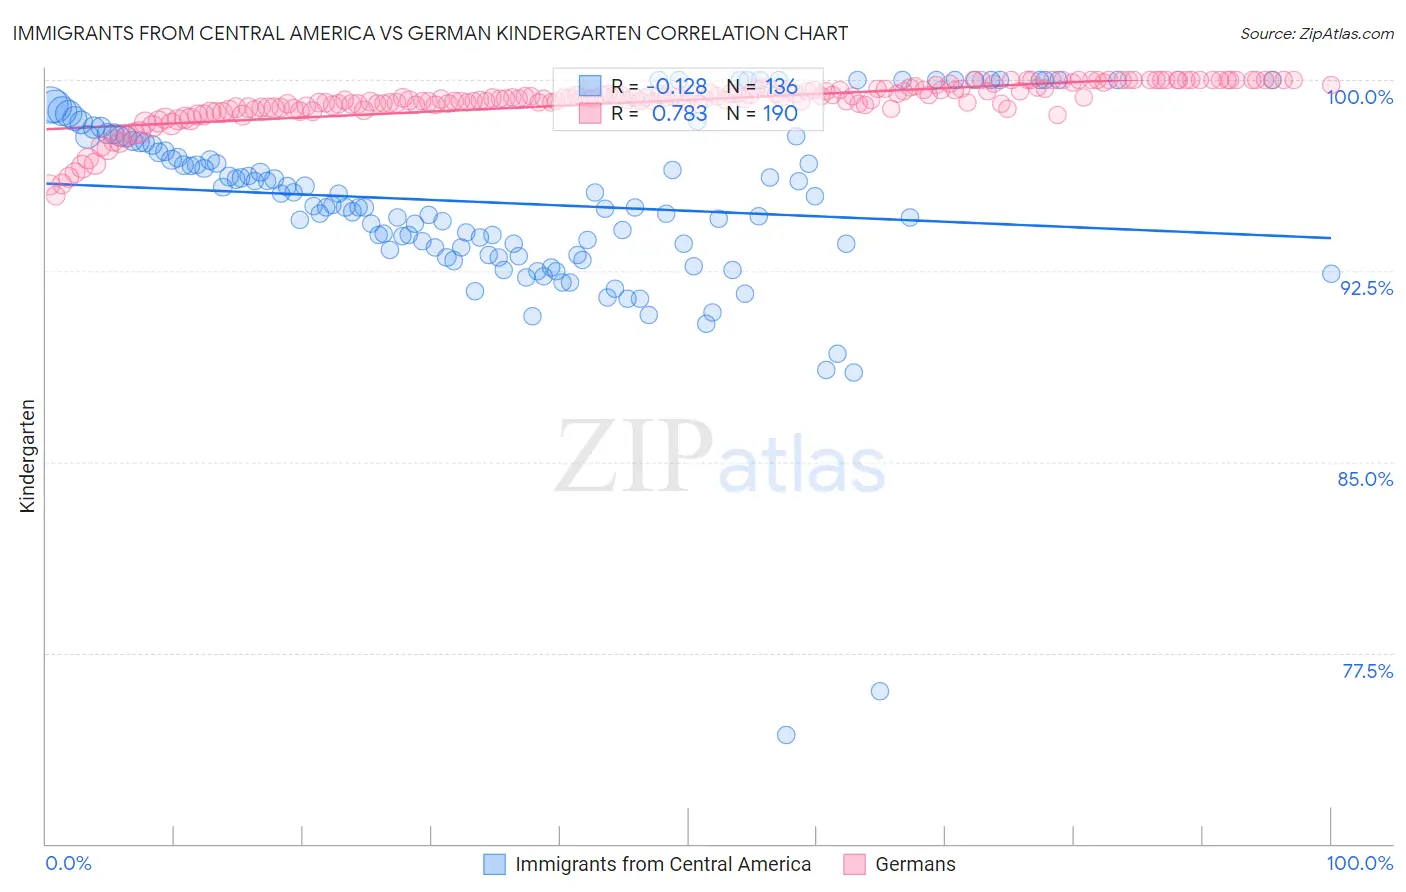
Immigrants from Central America vs German Kindergarten Correlation Chart
The statistical analysis conducted on geographies consisting of 536,554,221 people shows a poor negative correlation between the proportion of Immigrants from Central America and percentage of population with at least kindergarten education in the United States with a correlation coefficient (R) of -0.128 and weighted average of 96.4%. Similarly, the statistical analysis conducted on geographies consisting of 581,302,427 people shows a strong positive correlation between the proportion of Germans and percentage of population with at least kindergarten education in the United States with a correlation coefficient (R) of 0.783 and weighted average of 98.7%, a difference of 2.4%.
Kindergarten Correlation Summary
| Measurement | Immigrants from Central America | German |
| Minimum | 74.3% | 95.5% |
| Maximum | 100.0% | 100.0% |
| Range | 25.7% | 4.5% |
| Mean | 95.2% | 99.2% |
| Median | 95.1% | 99.3% |
| Interquartile 25% (IQ1) | 93.4% | 99.0% |
| Interquartile 75% (IQ3) | 97.6% | 99.6% |
| Interquartile Range (IQR) | 4.2% | 0.61% |
| Standard Deviation (Sample) | 3.7% | 0.82% |
| Standard Deviation (Population) | 3.7% | 0.82% |
Similar Demographics by Kindergarten
Demographics Similar to Immigrants from Central America by Kindergarten
In terms of kindergarten, the demographic groups most similar to Immigrants from Central America are Immigrants from Cabo Verde (96.4%, a difference of 0.0%), Immigrants from Guatemala (96.4%, a difference of 0.030%), Immigrants from Mexico (96.4%, a difference of 0.030%), Salvadoran (96.3%, a difference of 0.060%), and Immigrants from Fiji (96.5%, a difference of 0.11%).
| Demographics | Rating | Rank | Kindergarten |
| Central Americans | 0.0 /100 | #333 | Tragic 96.6% |
| Immigrants | Dominican Republic | 0.0 /100 | #334 | Tragic 96.6% |
| Bangladeshis | 0.0 /100 | #335 | Tragic 96.6% |
| Guatemalans | 0.0 /100 | #336 | Tragic 96.5% |
| Immigrants | Cambodia | 0.0 /100 | #337 | Tragic 96.5% |
| Immigrants | Fiji | 0.0 /100 | #338 | Tragic 96.5% |
| Immigrants | Guatemala | 0.0 /100 | #339 | Tragic 96.4% |
| Immigrants | Central America | 0.0 /100 | #340 | Tragic 96.4% |
| Immigrants | Cabo Verde | 0.0 /100 | #341 | Tragic 96.4% |
| Immigrants | Mexico | 0.0 /100 | #342 | Tragic 96.4% |
| Salvadorans | 0.0 /100 | #343 | Tragic 96.3% |
| Nepalese | 0.0 /100 | #344 | Tragic 96.2% |
| Immigrants | El Salvador | 0.0 /100 | #345 | Tragic 96.2% |
| Immigrants | Yemen | 0.0 /100 | #346 | Tragic 95.9% |
| Spanish American Indians | 0.0 /100 | #347 | Tragic 95.8% |
Demographics Similar to Germans by Kindergarten
In terms of kindergarten, the demographic groups most similar to Germans are Slovak (98.7%, a difference of 0.0%), Tlingit-Haida (98.7%, a difference of 0.010%), Norwegian (98.7%, a difference of 0.020%), Slovene (98.7%, a difference of 0.030%), and Alaska Native (98.7%, a difference of 0.040%).
| Demographics | Rating | Rank | Kindergarten |
| Welsh | 100.0 /100 | #4 | Exceptional 98.9% |
| Tsimshian | 100.0 /100 | #5 | Exceptional 98.8% |
| Alaskan Athabascans | 100.0 /100 | #6 | Exceptional 98.8% |
| Alaska Natives | 100.0 /100 | #7 | Exceptional 98.7% |
| Norwegians | 100.0 /100 | #8 | Exceptional 98.7% |
| Tlingit-Haida | 100.0 /100 | #9 | Exceptional 98.7% |
| Slovaks | 100.0 /100 | #10 | Exceptional 98.7% |
| Germans | 100.0 /100 | #11 | Exceptional 98.7% |
| Slovenes | 100.0 /100 | #12 | Exceptional 98.7% |
| Carpatho Rusyns | 100.0 /100 | #13 | Exceptional 98.7% |
| English | 100.0 /100 | #14 | Exceptional 98.7% |
| Swedes | 100.0 /100 | #15 | Exceptional 98.7% |
| Aleuts | 100.0 /100 | #16 | Exceptional 98.6% |
| Scottish | 100.0 /100 | #17 | Exceptional 98.6% |
| Dutch | 100.0 /100 | #18 | Exceptional 98.6% |