Immigrants from Brazil vs Immigrants from Nigeria Householder Income Over 65 years

COMPARE

Immigrants from Brazil
Race
Ancestry
AfghanAfricanAlaska NativeAlaskan AthabascanAlbanianAleutAlsatianAmericanApacheArabArapahoArgentineanArmenianAssyrian/Chaldean/SyriacAustralianAustrianBahamianBangladeshiBarbadianBasqueBelgianBelizeanBermudanBhutaneseBlackfeetBolivianBrazilianBritishBritish West IndianBulgarianBurmeseCajunCambodianCanadianCape VerdeanCarpatho RusynCelticCentral AmericanCentral American IndianCherokeeCheyenneChickasawChileanChineseChippewaChoctawColombianColvilleComancheCosta RicanCreeCreekCroatianCrowCubanCypriotCzechCzechoslovakianDanishDelawareDominicanDutchDutch West IndianEastern EuropeanEcuadorianEgyptianEnglishEstonianEthiopianEuropeanFijianFilipinoFinnishFrenchFrench American IndianFrench CanadianGermanGerman RussianGhanaianGreekGuamanian/ChamorroGuatemalanGuyaneseHaitianHmongHonduranHopiHoumaHungarianIcelanderIndian (Asian)IndonesianInupiatIranianIraqiIrishIroquoisIsraeliItalianJamaicanJapaneseJordanianKenyanKiowaKoreanLaotianLatvianLebaneseLiberianLithuanianLumbeeLuxembourgerMacedonianMalaysianMalteseMarshalleseMenomineeMexicanMexican American IndianMongolianMoroccanNative HawaiianNavajoNepaleseNew ZealanderNicaraguanNigerianNorthern EuropeanNorwegianOkinawanOsageOttawaPaiutePakistaniPalestinianPanamanianParaguayanPennsylvania GermanPeruvianPimaPolishPortuguesePotawatomiPuebloPuerto RicanPuget Sound SalishRomanianRussianSalvadoranSamoanScandinavianScotch-IrishScottishSeminoleSenegaleseSerbianShoshoneSierra LeoneanSiouxSlavicSlovakSloveneSomaliSouth AfricanSouth AmericanSouth American IndianSoviet UnionSpaniardSpanishSpanish AmericanSpanish American IndianSri LankanSubsaharan AfricanSudaneseSwedishSwissSyrianTaiwaneseThaiTlingit-HaidaTohono O'OdhamTonganTrinidadian and TobagonianTsimshianTurkishU.S. Virgin IslanderUgandanUkrainianUruguayanUteVenezuelanVietnameseWelshWest IndianYakamaYaquiYugoslavianYumanYup'ikZimbabwean
Immigration
NonimmigrantsImmigrantsAfghanistanAfricaAlbaniaArgentinaArmeniaAsiaAustraliaAustriaBahamasBangladeshBarbadosBelarusBelgiumBelizeBoliviaBosnia and HerzegovinaBrazilBulgariaBurma/MyanmarCabo VerdeCambodiaCameroonCanadaCaribbeanCentral AmericaChileChinaColombiaCongoCosta RicaCroatiaCubaCzechoslovakiaDenmarkDominicaDominican RepublicEastern AfricaEastern AsiaEastern EuropeEcuadorEgyptEl SalvadorEnglandEritreaEthiopiaEuropeFijiFranceGermanyGhanaGreeceGrenadaGuatemalaGuyanaHaitiHondurasHong KongHungaryIndiaIndonesiaIranIraqIrelandIsraelItalyJamaicaJapanJordanKazakhstanKenyaKoreaKuwaitLaosLatin AmericaLatviaLebanonLiberiaLithuaniaMalaysiaMexicoMicronesiaMiddle AfricaMoldovaMoroccoNepalNetherlandsNicaraguaNorth AmericaNorth MacedoniaNorthern AfricaNorthern EuropeNorwayOceaniaPakistanPanamaPeruPhilippinesPolandPortugalRomaniaRussiaSaudi ArabiaScotlandSenegalSerbiaSierra LeoneSingaporeSomaliaSouth AfricaSouth AmericaSouth Central AsiaSouth Eastern AsiaSouthern EuropeSpainSri LankaSt. Vincent and the GrenadinesSudanSwedenSwitzerlandSyriaTaiwanThailandTrinidad and TobagoTurkeyUgandaUkraineUruguayUzbekistanVenezuelaVietnamWest IndiesWestern AfricaWestern AsiaWestern EuropeYemenZaireZimbabweAzores
Immigrants from Nigeria
Race
Ancestry
AfghanAfricanAlaska NativeAlaskan AthabascanAlbanianAleutAlsatianAmericanApacheArabArapahoArgentineanArmenianAssyrian/Chaldean/SyriacAustralianAustrianBahamianBangladeshiBarbadianBasqueBelgianBelizeanBermudanBhutaneseBlackfeetBolivianBrazilianBritishBritish West IndianBulgarianBurmeseCajunCambodianCanadianCape VerdeanCarpatho RusynCelticCentral AmericanCentral American IndianCherokeeCheyenneChickasawChileanChineseChippewaChoctawColombianColvilleComancheCosta RicanCreeCreekCroatianCrowCubanCypriotCzechCzechoslovakianDanishDelawareDominicanDutchDutch West IndianEastern EuropeanEcuadorianEgyptianEnglishEstonianEthiopianEuropeanFijianFilipinoFinnishFrenchFrench American IndianFrench CanadianGermanGerman RussianGhanaianGreekGuamanian/ChamorroGuatemalanGuyaneseHaitianHmongHonduranHopiHoumaHungarianIcelanderIndian (Asian)IndonesianInupiatIranianIraqiIrishIroquoisIsraeliItalianJamaicanJapaneseJordanianKenyanKiowaKoreanLaotianLatvianLebaneseLiberianLithuanianLumbeeLuxembourgerMacedonianMalaysianMalteseMarshalleseMenomineeMexicanMexican American IndianMongolianMoroccanNative HawaiianNavajoNepaleseNew ZealanderNicaraguanNigerianNorthern EuropeanNorwegianOkinawanOsageOttawaPaiutePakistaniPalestinianPanamanianParaguayanPennsylvania GermanPeruvianPimaPolishPortuguesePotawatomiPuebloPuerto RicanPuget Sound SalishRomanianRussianSalvadoranSamoanScandinavianScotch-IrishScottishSeminoleSenegaleseSerbianShoshoneSierra LeoneanSiouxSlavicSlovakSloveneSomaliSouth AfricanSouth AmericanSouth American IndianSoviet UnionSpaniardSpanishSpanish AmericanSpanish American IndianSri LankanSubsaharan AfricanSudaneseSwedishSwissSyrianTaiwaneseThaiTlingit-HaidaTohono O'OdhamTonganTrinidadian and TobagonianTsimshianTurkishU.S. Virgin IslanderUgandanUkrainianUruguayanUteVenezuelanVietnameseWelshWest IndianYakamaYaquiYugoslavianYumanYup'ikZimbabwean
Immigration
NonimmigrantsImmigrantsAfghanistanAfricaAlbaniaArgentinaArmeniaAsiaAustraliaAustriaBahamasBangladeshBarbadosBelarusBelgiumBelizeBoliviaBosnia and HerzegovinaBulgariaBurma/MyanmarCabo VerdeCambodiaCameroonCanadaCaribbeanCentral AmericaChileChinaColombiaCongoCosta RicaCroatiaCubaCzechoslovakiaDenmarkDominicaDominican RepublicEastern AfricaEastern AsiaEastern EuropeEcuadorEgyptEl SalvadorEnglandEritreaEthiopiaEuropeFijiFranceGermanyGhanaGreeceGrenadaGuatemalaGuyanaHaitiHondurasHong KongHungaryIndiaIndonesiaIranIraqIrelandIsraelItalyJamaicaJapanJordanKazakhstanKenyaKoreaKuwaitLaosLatin AmericaLatviaLebanonLiberiaLithuaniaMalaysiaMexicoMicronesiaMiddle AfricaMoldovaMoroccoNepalNetherlandsNicaraguaNigeriaNorth AmericaNorth MacedoniaNorthern AfricaNorthern EuropeNorwayOceaniaPakistanPanamaPeruPhilippinesPolandPortugalRomaniaRussiaSaudi ArabiaScotlandSenegalSerbiaSierra LeoneSingaporeSomaliaSouth AfricaSouth AmericaSouth Central AsiaSouth Eastern AsiaSouthern EuropeSpainSri LankaSt. Vincent and the GrenadinesSudanSwedenSwitzerlandSyriaTaiwanThailandTrinidad and TobagoTurkeyUgandaUkraineUruguayUzbekistanVenezuelaVietnamWest IndiesWestern AfricaWestern AsiaWestern EuropeYemenZaireZimbabweAzores
Householder Income Over 65 years
Income
Poverty
Unemployment
Labor Participation
Family Structure
Vehicle Availability
Education Level
Disability

Householder Income Over 65 years Comparison

Immigrants from Brazil

Immigrants from Nigeria

Excellent
Poor
$62,364
HOUSEHOLDER INCOME OVER 65 YEARS
81.2/ 100
METRIC RATING
134th/ 347
METRIC RANK
$58,942
HOUSEHOLDER INCOME OVER 65 YEARS
10.7/ 100
METRIC RATING
211th/ 347
METRIC RANK

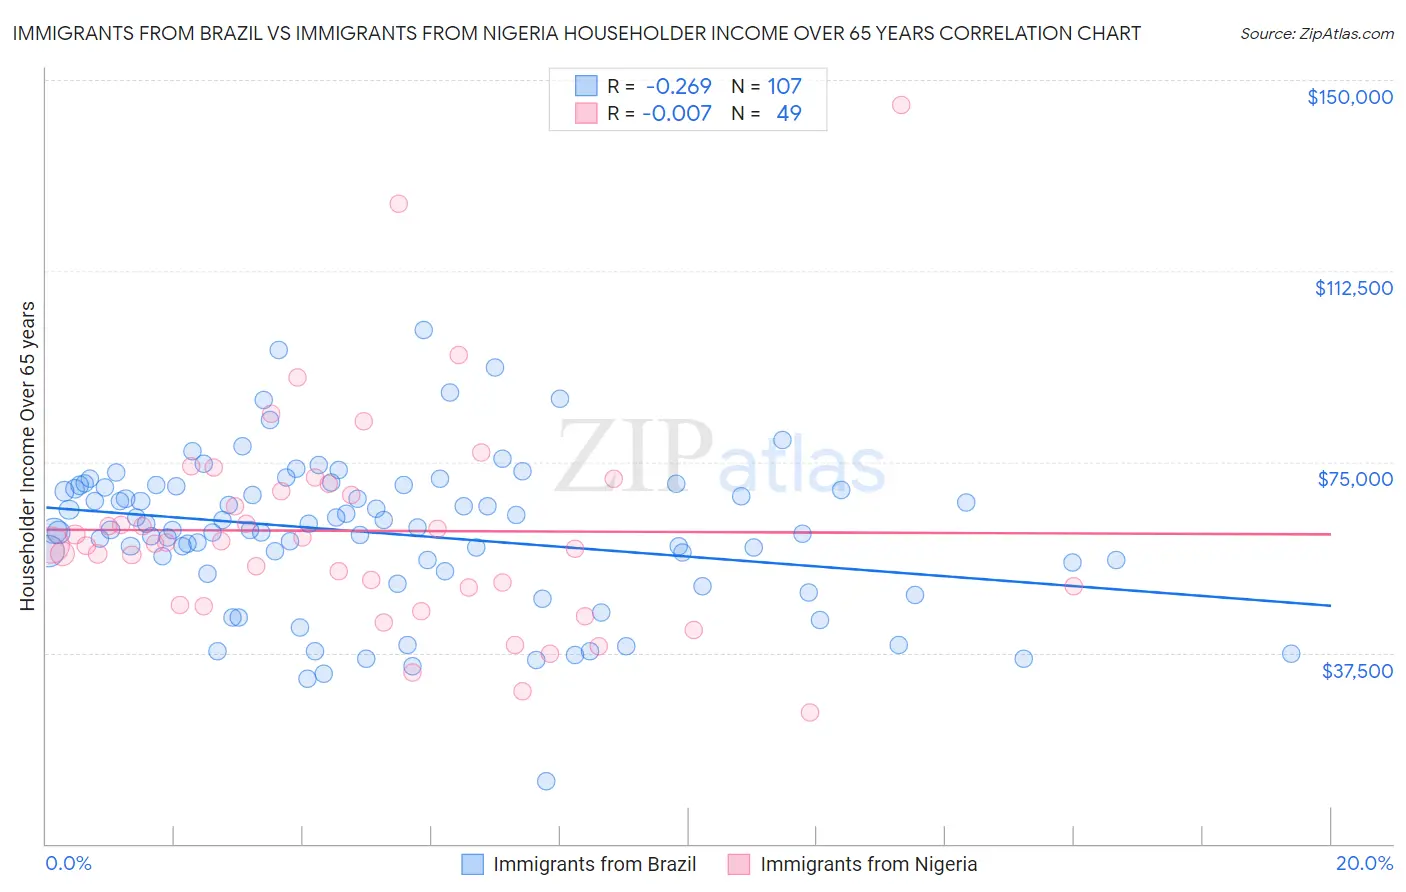
Immigrants from Brazil vs Immigrants from Nigeria Householder Income Over 65 years Correlation Chart

The statistical analysis conducted on geographies consisting of 342,081,092 people shows a weak negative correlation between the proportion of Immigrants from Brazil and household income with householder over the age of 65 in the United States with a correlation coefficient (R) of -0.269 and weighted average of $62,364. Similarly, the statistical analysis conducted on geographies consisting of 282,793,779 people shows no correlation between the proportion of Immigrants from Nigeria and household income with householder over the age of 65 in the United States with a correlation coefficient (R) of -0.007 and weighted average of $58,942, a difference of 5.8%.
Immigrants from Brazil vs Immigrants from Nigeria Householder Income Over 65 years

Householder Income Over 65 years Correlation Summary

MeasurementImmigrants from BrazilImmigrants from Nigeria
Minimum$12,293$25,694
Maximum$100,809$145,083
Range$88,516$119,389
Mean$60,924$61,464
Median$61,677$59,036
Interquartile 25% (IQ1)$53,466$48,637
Interquartile 75% (IQ3)$70,121$70,015
Interquartile Range (IQR)$16,655$21,378
Standard Deviation (Sample)$14,904$21,491
Standard Deviation (Population)$14,834$21,270

Similar Demographics by Householder Income Over 65 years

Demographics Similar to Immigrants from Brazil by Householder Income Over 65 years

In terms of householder income over 65 years, the demographic groups most similar to Immigrants from Brazil are Immigrants from Chile ($62,354, a difference of 0.020%), Alaskan Athabascan ($62,330, a difference of 0.060%), Immigrants from Syria ($62,303, a difference of 0.10%), Immigrants from Kazakhstan ($62,292, a difference of 0.12%), and Lebanese ($62,287, a difference of 0.12%).
DemographicsRating | RankHouseholder Income Over 65 years
Swedes
86.4
/100
|
#127
Excellent
$62,736
Aleuts
86.1
/100
|
#128
Excellent
$62,708
Immigrants | Eastern Europe
85.9
/100
|
#129
Excellent
$62,693
Basques
85.4
/100
|
#130
Excellent
$62,653
Immigrants | Western Asia
85.3
/100
|
#131
Excellent
$62,645
Immigrants | Germany
83.9
/100
|
#132
Excellent
$62,544
Immigrants | Northern Africa
83.6
/100
|
#133
Excellent
$62,522
Immigrants | Brazil
81.2
/100
|
#134
Excellent
$62,364
Immigrants | Chile
81.0
/100
|
#135
Excellent
$62,354
Alaskan Athabascans
80.6
/100
|
#136
Excellent
$62,330
Immigrants | Syria
80.2
/100
|
#137
Excellent
$62,303
Immigrants | Kazakhstan
80.0
/100
|
#138
Excellent
$62,292
Lebanese
79.9
/100
|
#139
Good
$62,287
Arabs
79.6
/100
|
#140
Good
$62,266
Canadians
79.0
/100
|
#141
Good
$62,230

Demographics Similar to Immigrants from Nigeria by Householder Income Over 65 years

In terms of householder income over 65 years, the demographic groups most similar to Immigrants from Nigeria are Nigerian ($58,992, a difference of 0.090%), Colombian ($58,851, a difference of 0.15%), Slovak ($59,039, a difference of 0.16%), White/Caucasian ($58,847, a difference of 0.16%), and Uruguayan ($59,090, a difference of 0.25%).
DemographicsRating | RankHouseholder Income Over 65 years
Arapaho
16.0
/100
|
#204
Poor
$59,383
Immigrants | Sudan
14.2
/100
|
#205
Poor
$59,248
Immigrants | South America
13.0
/100
|
#206
Poor
$59,151
Salvadorans
12.9
/100
|
#207
Poor
$59,141
Uruguayans
12.3
/100
|
#208
Poor
$59,090
Slovaks
11.7
/100
|
#209
Poor
$59,039
Nigerians
11.2
/100
|
#210
Poor
$58,992
Immigrants | Nigeria
10.7
/100
|
#211
Poor
$58,942
Colombians
9.8
/100
|
#212
Tragic
$58,851
Whites/Caucasians
9.8
/100
|
#213
Tragic
$58,847
Nepalese
9.0
/100
|
#214
Tragic
$58,761
Immigrants | Ghana
7.9
/100
|
#215
Tragic
$58,624
Immigrants | Middle Africa
6.2
/100
|
#216
Tragic
$58,375
Sudanese
5.7
/100
|
#217
Tragic
$58,281
Panamanians
5.6
/100
|
#218
Tragic
$58,266