Immigrants from Brazil vs Immigrants from Nigeria Disability Age 35 to 64
COMPARE
Immigrants from Brazil
Immigrants from Nigeria
Disability Age 35 to 64
Disability Age 35 to 64 Comparison
Immigrants from Brazil
Immigrants from Nigeria
10.2%
DISABILITY AGE 35 TO 64
99.2/ 100
METRIC RATING
83rd/ 347
METRIC RANK
11.4%
DISABILITY AGE 35 TO 64
32.5/ 100
METRIC RATING
190th/ 347
METRIC RANK
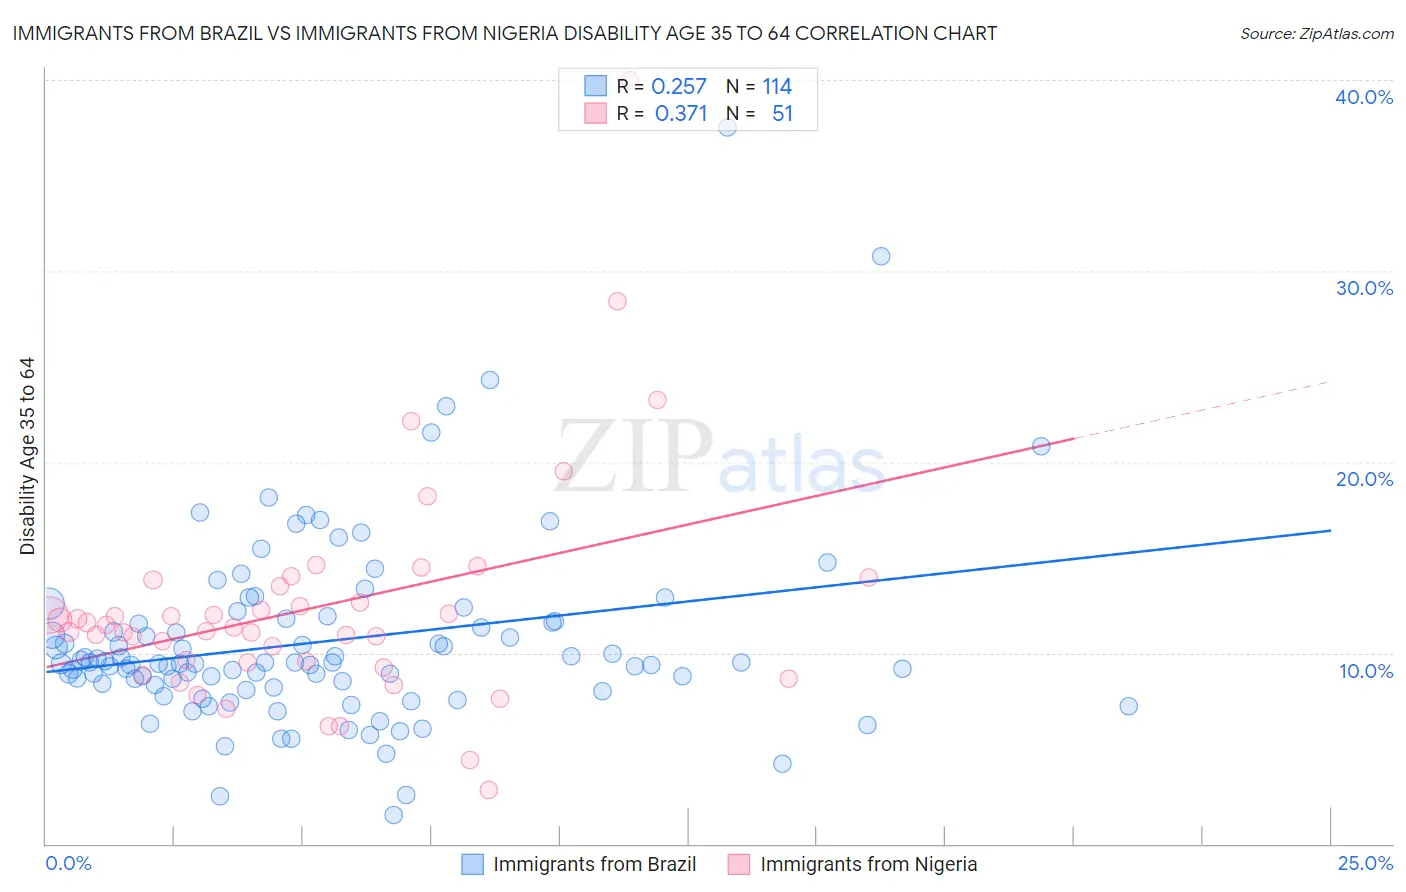
Immigrants from Brazil vs Immigrants from Nigeria Disability Age 35 to 64 Correlation Chart
The statistical analysis conducted on geographies consisting of 342,837,790 people shows a weak positive correlation between the proportion of Immigrants from Brazil and percentage of population with a disability between the ages 34 and 64 in the United States with a correlation coefficient (R) of 0.257 and weighted average of 10.2%. Similarly, the statistical analysis conducted on geographies consisting of 283,291,539 people shows a mild positive correlation between the proportion of Immigrants from Nigeria and percentage of population with a disability between the ages 34 and 64 in the United States with a correlation coefficient (R) of 0.371 and weighted average of 11.4%, a difference of 12.4%.
Disability Age 35 to 64 Correlation Summary
| Measurement | Immigrants from Brazil | Immigrants from Nigeria |
| Minimum | 1.5% | 2.8% |
| Maximum | 37.5% | 40.0% |
| Range | 36.0% | 37.2% |
| Mean | 10.6% | 12.3% |
| Median | 9.5% | 11.3% |
| Interquartile 25% (IQ1) | 8.3% | 9.5% |
| Interquartile 75% (IQ3) | 11.7% | 13.5% |
| Interquartile Range (IQR) | 3.3% | 4.0% |
| Standard Deviation (Sample) | 5.0% | 5.9% |
| Standard Deviation (Population) | 5.0% | 5.9% |
Similar Demographics by Disability Age 35 to 64
Demographics Similar to Immigrants from Brazil by Disability Age 35 to 64
In terms of disability age 35 to 64, the demographic groups most similar to Immigrants from Brazil are Russian (10.2%, a difference of 0.020%), Sri Lankan (10.2%, a difference of 0.060%), Latvian (10.2%, a difference of 0.070%), Immigrants from Croatia (10.2%, a difference of 0.17%), and Immigrants from Kuwait (10.2%, a difference of 0.27%).
| Demographics | Rating | Rank | Disability Age 35 to 64 |
| Immigrants | Chile | 99.4 /100 | #76 | Exceptional 10.1% |
| Mongolians | 99.4 /100 | #77 | Exceptional 10.1% |
| Jordanians | 99.3 /100 | #78 | Exceptional 10.1% |
| Immigrants | Vietnam | 99.3 /100 | #79 | Exceptional 10.1% |
| Immigrants | Croatia | 99.3 /100 | #80 | Exceptional 10.2% |
| Latvians | 99.2 /100 | #81 | Exceptional 10.2% |
| Russians | 99.2 /100 | #82 | Exceptional 10.2% |
| Immigrants | Brazil | 99.2 /100 | #83 | Exceptional 10.2% |
| Sri Lankans | 99.2 /100 | #84 | Exceptional 10.2% |
| Immigrants | Kuwait | 99.1 /100 | #85 | Exceptional 10.2% |
| Immigrants | Europe | 99.1 /100 | #86 | Exceptional 10.2% |
| Nicaraguans | 99.1 /100 | #87 | Exceptional 10.2% |
| Chileans | 99.0 /100 | #88 | Exceptional 10.2% |
| Uruguayans | 99.0 /100 | #89 | Exceptional 10.2% |
| Afghans | 98.9 /100 | #90 | Exceptional 10.3% |
Demographics Similar to Immigrants from Nigeria by Disability Age 35 to 64
In terms of disability age 35 to 64, the demographic groups most similar to Immigrants from Nigeria are Swedish (11.4%, a difference of 0.11%), Hungarian (11.4%, a difference of 0.19%), Northern European (11.4%, a difference of 0.21%), Immigrants from Bosnia and Herzegovina (11.4%, a difference of 0.24%), and Norwegian (11.5%, a difference of 0.26%).
| Demographics | Rating | Rank | Disability Age 35 to 64 |
| Immigrants | Oceania | 39.5 /100 | #183 | Fair 11.4% |
| Kenyans | 39.2 /100 | #184 | Fair 11.4% |
| Danes | 36.8 /100 | #185 | Fair 11.4% |
| Slovenes | 36.6 /100 | #186 | Fair 11.4% |
| Immigrants | Bosnia and Herzegovina | 35.2 /100 | #187 | Fair 11.4% |
| Northern Europeans | 34.9 /100 | #188 | Fair 11.4% |
| Hungarians | 34.6 /100 | #189 | Fair 11.4% |
| Immigrants | Nigeria | 32.5 /100 | #190 | Fair 11.4% |
| Swedes | 31.3 /100 | #191 | Fair 11.4% |
| Norwegians | 29.7 /100 | #192 | Fair 11.5% |
| Immigrants | Africa | 29.0 /100 | #193 | Fair 11.5% |
| Immigrants | Latin America | 27.5 /100 | #194 | Fair 11.5% |
| Carpatho Rusyns | 25.3 /100 | #195 | Fair 11.5% |
| Iraqis | 24.2 /100 | #196 | Fair 11.5% |
| Immigrants | Iraq | 21.0 /100 | #197 | Fair 11.6% |