Immigrants from Belarus vs Immigrants from Honduras Wage/Income Gap
COMPARE
Immigrants from Belarus
Immigrants from Honduras
Wage/Income Gap
Wage/Income Gap Comparison
Immigrants from Belarus
Immigrants from Honduras
25.7%
WAGE/INCOME GAP
52.9/ 100
METRIC RATING
173rd/ 347
METRIC RANK
23.5%
WAGE/INCOME GAP
99.5/ 100
METRIC RATING
92nd/ 347
METRIC RANK
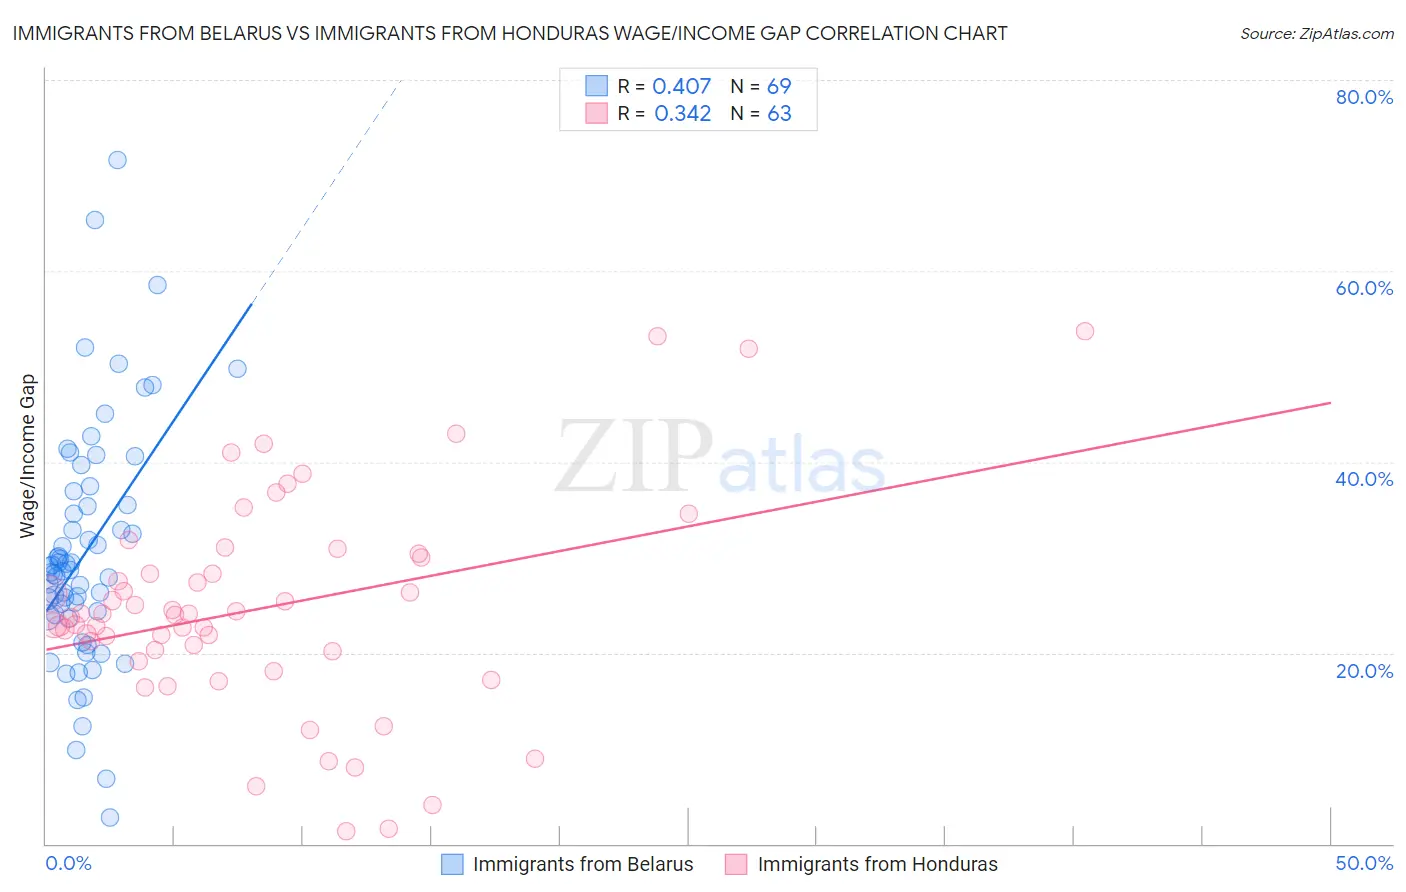
Immigrants from Belarus vs Immigrants from Honduras Wage/Income Gap Correlation Chart
The statistical analysis conducted on geographies consisting of 150,180,319 people shows a moderate positive correlation between the proportion of Immigrants from Belarus and wage/income gap percentage in the United States with a correlation coefficient (R) of 0.407 and weighted average of 25.7%. Similarly, the statistical analysis conducted on geographies consisting of 322,424,555 people shows a mild positive correlation between the proportion of Immigrants from Honduras and wage/income gap percentage in the United States with a correlation coefficient (R) of 0.342 and weighted average of 23.5%, a difference of 9.5%.
Wage/Income Gap Correlation Summary
| Measurement | Immigrants from Belarus | Immigrants from Honduras |
| Minimum | 2.8% | 1.3% |
| Maximum | 71.7% | 53.7% |
| Range | 68.9% | 52.4% |
| Mean | 30.5% | 24.6% |
| Median | 28.7% | 24.0% |
| Interquartile 25% (IQ1) | 23.9% | 20.2% |
| Interquartile 75% (IQ3) | 36.2% | 30.0% |
| Interquartile Range (IQR) | 12.3% | 9.8% |
| Standard Deviation (Sample) | 12.5% | 11.1% |
| Standard Deviation (Population) | 12.4% | 11.0% |
Similar Demographics by Wage/Income Gap
Demographics Similar to Immigrants from Belarus by Wage/Income Gap
In terms of wage/income gap, the demographic groups most similar to Immigrants from Belarus are Immigrants from Chile (25.7%, a difference of 0.020%), Alaskan Athabascan (25.8%, a difference of 0.19%), Immigrants from Greece (25.7%, a difference of 0.24%), Immigrants from Oceania (25.6%, a difference of 0.31%), and Sri Lankan (25.8%, a difference of 0.39%).
| Demographics | Rating | Rank | Wage/Income Gap |
| Immigrants | Ukraine | 63.8 /100 | #166 | Good 25.5% |
| Paiute | 62.9 /100 | #167 | Good 25.5% |
| Seminole | 62.6 /100 | #168 | Good 25.6% |
| Peruvians | 60.1 /100 | #169 | Good 25.6% |
| Immigrants | Oceania | 57.5 /100 | #170 | Average 25.6% |
| Immigrants | Greece | 56.6 /100 | #171 | Average 25.7% |
| Immigrants | Chile | 53.2 /100 | #172 | Average 25.7% |
| Immigrants | Belarus | 52.9 /100 | #173 | Average 25.7% |
| Alaskan Athabascans | 50.0 /100 | #174 | Average 25.8% |
| Sri Lankans | 47.0 /100 | #175 | Average 25.8% |
| Paraguayans | 46.7 /100 | #176 | Average 25.8% |
| Cambodians | 45.1 /100 | #177 | Average 25.8% |
| Chinese | 42.0 /100 | #178 | Average 25.9% |
| Samoans | 38.6 /100 | #179 | Fair 26.0% |
| Guamanians/Chamorros | 38.0 /100 | #180 | Fair 26.0% |
Demographics Similar to Immigrants from Honduras by Wage/Income Gap
In terms of wage/income gap, the demographic groups most similar to Immigrants from Honduras are Arapaho (23.5%, a difference of 0.15%), Immigrants from Cabo Verde (23.6%, a difference of 0.24%), Nicaraguan (23.4%, a difference of 0.29%), Marshallese (23.4%, a difference of 0.30%), and Honduran (23.6%, a difference of 0.33%).
| Demographics | Rating | Rank | Wage/Income Gap |
| Immigrants | Cambodia | 99.7 /100 | #85 | Exceptional 23.3% |
| Cheyenne | 99.7 /100 | #86 | Exceptional 23.3% |
| Yuman | 99.7 /100 | #87 | Exceptional 23.3% |
| Immigrants | Panama | 99.6 /100 | #88 | Exceptional 23.4% |
| Marshallese | 99.6 /100 | #89 | Exceptional 23.4% |
| Nicaraguans | 99.6 /100 | #90 | Exceptional 23.4% |
| Arapaho | 99.6 /100 | #91 | Exceptional 23.5% |
| Immigrants | Honduras | 99.5 /100 | #92 | Exceptional 23.5% |
| Immigrants | Cabo Verde | 99.5 /100 | #93 | Exceptional 23.6% |
| Hondurans | 99.5 /100 | #94 | Exceptional 23.6% |
| Cape Verdeans | 99.4 /100 | #95 | Exceptional 23.6% |
| Kiowa | 99.4 /100 | #96 | Exceptional 23.6% |
| Immigrants | Sudan | 99.4 /100 | #97 | Exceptional 23.6% |
| Immigrants | Latin America | 99.2 /100 | #98 | Exceptional 23.7% |
| Aleuts | 99.2 /100 | #99 | Exceptional 23.7% |