Immigrants from Barbados vs Immigrants from South Central Asia Median Earnings
COMPARE
Immigrants from Barbados
Immigrants from South Central Asia
Median Earnings
Median Earnings Comparison
Immigrants from Barbados
Immigrants from South Central Asia
$45,816
MEDIAN EARNINGS
29.6/ 100
METRIC RATING
199th/ 347
METRIC RANK
$57,114
MEDIAN EARNINGS
100.0/ 100
METRIC RATING
10th/ 347
METRIC RANK
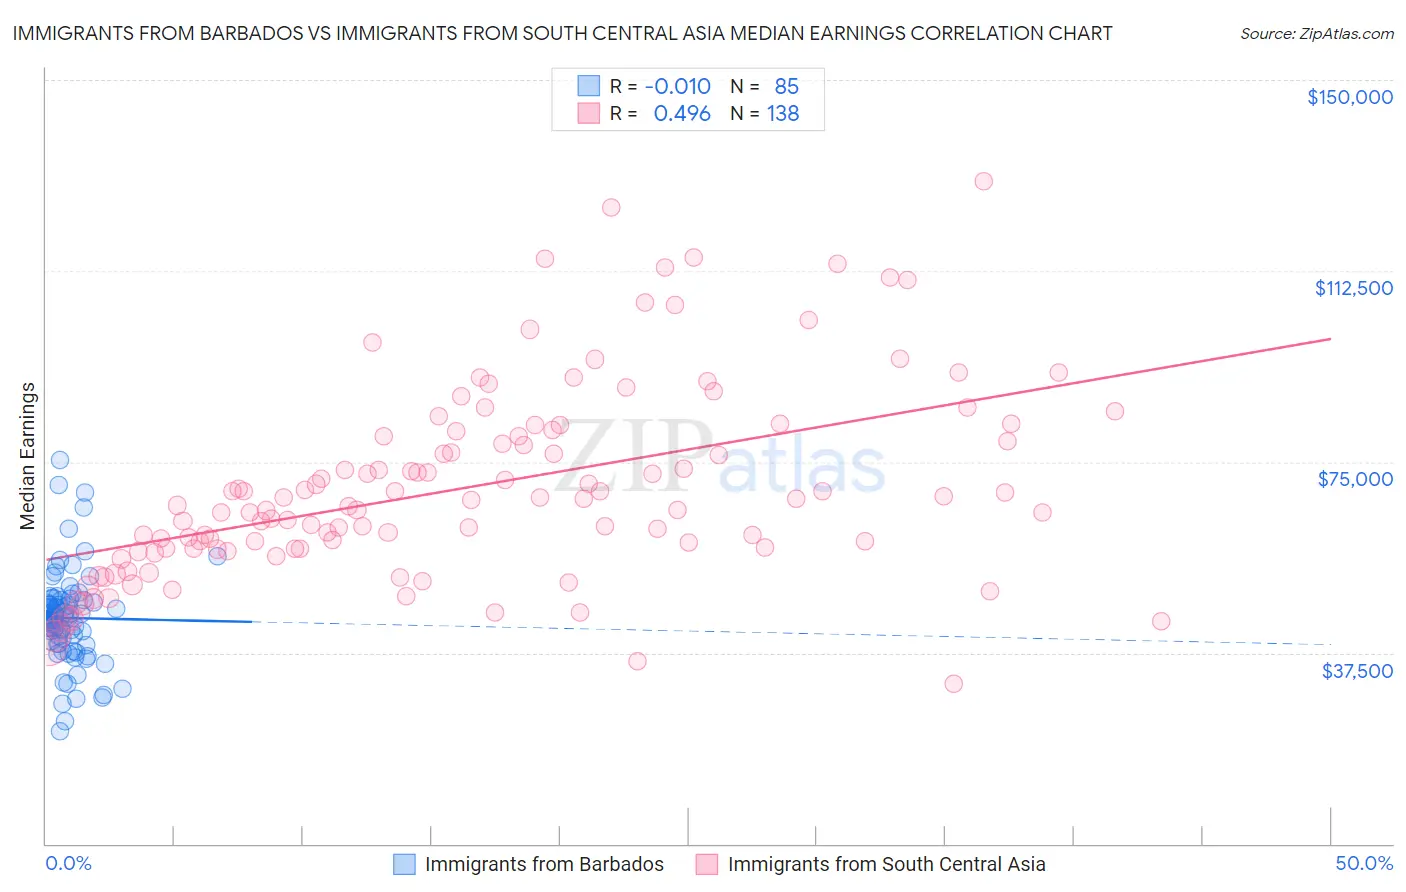
Immigrants from Barbados vs Immigrants from South Central Asia Median Earnings Correlation Chart
The statistical analysis conducted on geographies consisting of 112,759,497 people shows no correlation between the proportion of Immigrants from Barbados and median earnings in the United States with a correlation coefficient (R) of -0.010 and weighted average of $45,816. Similarly, the statistical analysis conducted on geographies consisting of 473,088,243 people shows a moderate positive correlation between the proportion of Immigrants from South Central Asia and median earnings in the United States with a correlation coefficient (R) of 0.496 and weighted average of $57,114, a difference of 24.7%.
Median Earnings Correlation Summary
| Measurement | Immigrants from Barbados | Immigrants from South Central Asia |
| Minimum | $22,067 | $31,327 |
| Maximum | $75,335 | $130,186 |
| Range | $53,268 | $98,859 |
| Mean | $44,348 | $69,984 |
| Median | $44,360 | $66,961 |
| Interquartile 25% (IQ1) | $39,293 | $57,896 |
| Interquartile 75% (IQ3) | $47,976 | $80,093 |
| Interquartile Range (IQR) | $8,683 | $22,197 |
| Standard Deviation (Sample) | $9,386 | $19,016 |
| Standard Deviation (Population) | $9,331 | $18,947 |
Similar Demographics by Median Earnings
Demographics Similar to Immigrants from Barbados by Median Earnings
In terms of median earnings, the demographic groups most similar to Immigrants from Barbados are Trinidadian and Tobagonian ($45,820, a difference of 0.010%), Immigrants from the Azores ($45,812, a difference of 0.010%), Barbadian ($45,846, a difference of 0.060%), Yugoslavian ($45,846, a difference of 0.070%), and Celtic ($45,732, a difference of 0.18%).
| Demographics | Rating | Rank | Median Earnings |
| Germans | 33.2 /100 | #192 | Fair $45,935 |
| Guamanians/Chamorros | 33.2 /100 | #193 | Fair $45,933 |
| Immigrants | Costa Rica | 33.0 /100 | #194 | Fair $45,928 |
| Immigrants | St. Vincent and the Grenadines | 32.4 /100 | #195 | Fair $45,908 |
| Yugoslavians | 30.5 /100 | #196 | Fair $45,846 |
| Barbadians | 30.5 /100 | #197 | Fair $45,846 |
| Trinidadians and Tobagonians | 29.7 /100 | #198 | Fair $45,820 |
| Immigrants | Barbados | 29.6 /100 | #199 | Fair $45,816 |
| Immigrants | Azores | 29.5 /100 | #200 | Fair $45,812 |
| Celtics | 27.2 /100 | #201 | Fair $45,732 |
| Immigrants | Trinidad and Tobago | 27.1 /100 | #202 | Fair $45,729 |
| Welsh | 26.6 /100 | #203 | Fair $45,710 |
| Immigrants | Uruguay | 25.9 /100 | #204 | Fair $45,682 |
| Tongans | 25.4 /100 | #205 | Fair $45,665 |
| Immigrants | Ghana | 24.8 /100 | #206 | Fair $45,641 |
Demographics Similar to Immigrants from South Central Asia by Median Earnings
In terms of median earnings, the demographic groups most similar to Immigrants from South Central Asia are Immigrants from Israel ($57,034, a difference of 0.14%), Immigrants from Ireland ($56,854, a difference of 0.46%), Okinawan ($57,550, a difference of 0.76%), Immigrants from China ($56,638, a difference of 0.84%), and Immigrants from Iran ($57,612, a difference of 0.87%).
| Demographics | Rating | Rank | Median Earnings |
| Immigrants | India | 100.0 /100 | #3 | Exceptional $60,648 |
| Immigrants | Hong Kong | 100.0 /100 | #4 | Exceptional $59,433 |
| Thais | 100.0 /100 | #5 | Exceptional $59,237 |
| Immigrants | Singapore | 100.0 /100 | #6 | Exceptional $59,038 |
| Iranians | 100.0 /100 | #7 | Exceptional $58,474 |
| Immigrants | Iran | 100.0 /100 | #8 | Exceptional $57,612 |
| Okinawans | 100.0 /100 | #9 | Exceptional $57,550 |
| Immigrants | South Central Asia | 100.0 /100 | #10 | Exceptional $57,114 |
| Immigrants | Israel | 100.0 /100 | #11 | Exceptional $57,034 |
| Immigrants | Ireland | 100.0 /100 | #12 | Exceptional $56,854 |
| Immigrants | China | 100.0 /100 | #13 | Exceptional $56,638 |
| Immigrants | Australia | 100.0 /100 | #14 | Exceptional $56,305 |
| Indians (Asian) | 100.0 /100 | #15 | Exceptional $56,253 |
| Immigrants | Eastern Asia | 100.0 /100 | #16 | Exceptional $56,183 |
| Eastern Europeans | 100.0 /100 | #17 | Exceptional $55,084 |