British West Indian vs Immigrants from South Central Asia Median Earnings
COMPARE
British West Indian
Immigrants from South Central Asia
Median Earnings
Median Earnings Comparison
British West Indians
Immigrants from South Central Asia
$44,552
MEDIAN EARNINGS
6.7/ 100
METRIC RATING
236th/ 347
METRIC RANK
$57,114
MEDIAN EARNINGS
100.0/ 100
METRIC RATING
10th/ 347
METRIC RANK
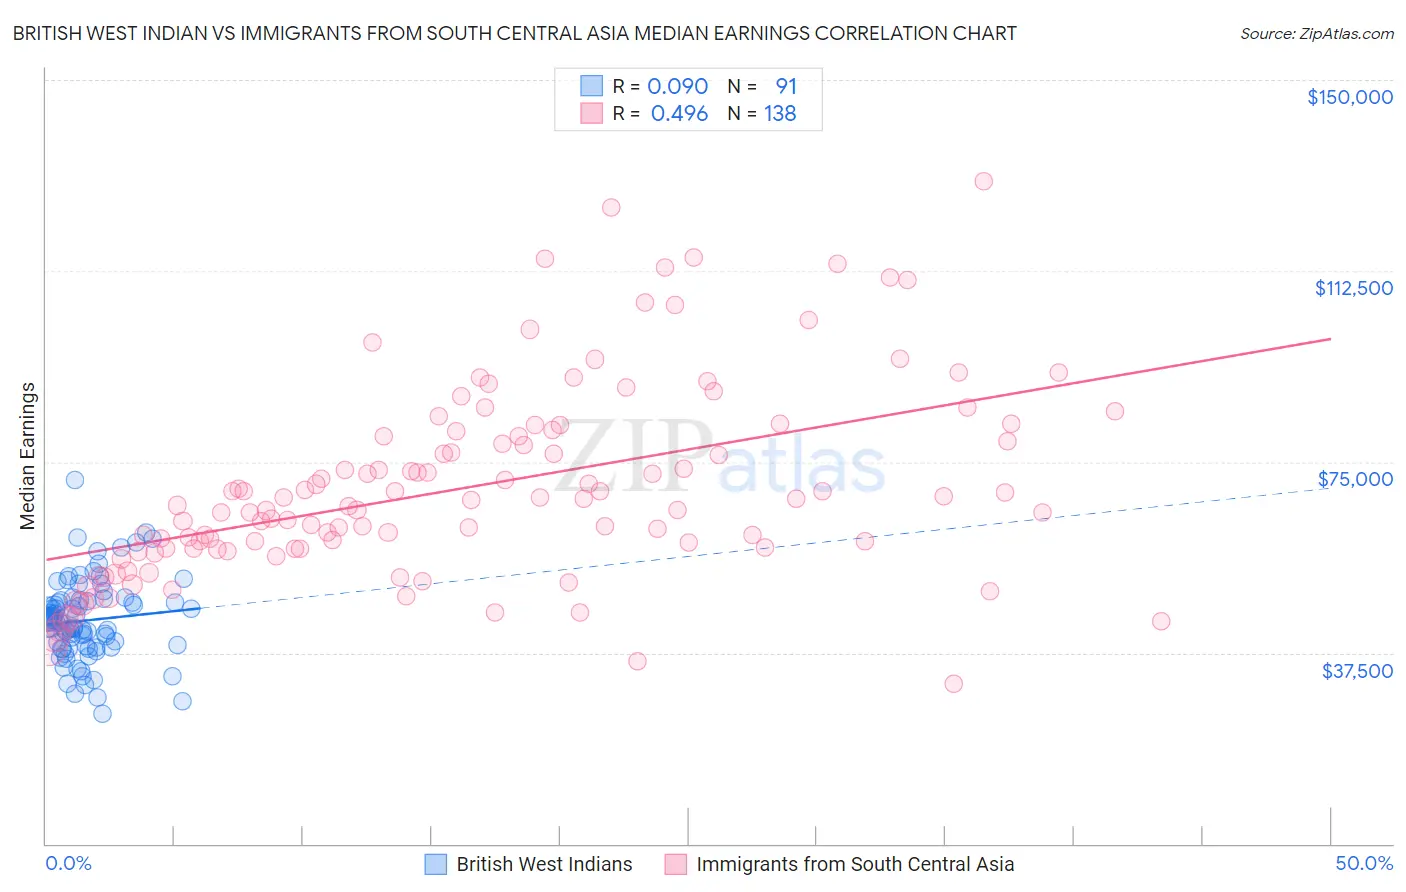
British West Indian vs Immigrants from South Central Asia Median Earnings Correlation Chart
The statistical analysis conducted on geographies consisting of 152,701,918 people shows a slight positive correlation between the proportion of British West Indians and median earnings in the United States with a correlation coefficient (R) of 0.090 and weighted average of $44,552. Similarly, the statistical analysis conducted on geographies consisting of 473,088,243 people shows a moderate positive correlation between the proportion of Immigrants from South Central Asia and median earnings in the United States with a correlation coefficient (R) of 0.496 and weighted average of $57,114, a difference of 28.2%.
Median Earnings Correlation Summary
| Measurement | British West Indian | Immigrants from South Central Asia |
| Minimum | $25,617 | $31,327 |
| Maximum | $71,446 | $130,186 |
| Range | $45,829 | $98,859 |
| Mean | $43,859 | $69,984 |
| Median | $43,512 | $66,961 |
| Interquartile 25% (IQ1) | $38,648 | $57,896 |
| Interquartile 75% (IQ3) | $47,645 | $80,093 |
| Interquartile Range (IQR) | $8,997 | $22,197 |
| Standard Deviation (Sample) | $7,987 | $19,016 |
| Standard Deviation (Population) | $7,943 | $18,947 |
Similar Demographics by Median Earnings
Demographics Similar to British West Indians by Median Earnings
In terms of median earnings, the demographic groups most similar to British West Indians are Venezuelan ($44,580, a difference of 0.060%), Cape Verdean ($44,640, a difference of 0.20%), Immigrants from Ecuador ($44,462, a difference of 0.20%), Sudanese ($44,419, a difference of 0.30%), and Senegalese ($44,373, a difference of 0.40%).
| Demographics | Rating | Rank | Median Earnings |
| Scotch-Irish | 10.7 /100 | #229 | Poor $44,924 |
| Immigrants | Western Africa | 10.3 /100 | #230 | Poor $44,893 |
| Japanese | 9.5 /100 | #231 | Tragic $44,825 |
| Delaware | 9.0 /100 | #232 | Tragic $44,783 |
| Immigrants | Sudan | 8.8 /100 | #233 | Tragic $44,767 |
| Cape Verdeans | 7.5 /100 | #234 | Tragic $44,640 |
| Venezuelans | 6.9 /100 | #235 | Tragic $44,580 |
| British West Indians | 6.7 /100 | #236 | Tragic $44,552 |
| Immigrants | Ecuador | 5.9 /100 | #237 | Tragic $44,462 |
| Sudanese | 5.6 /100 | #238 | Tragic $44,419 |
| Senegalese | 5.3 /100 | #239 | Tragic $44,373 |
| Aleuts | 4.4 /100 | #240 | Tragic $44,241 |
| Samoans | 4.2 /100 | #241 | Tragic $44,206 |
| Immigrants | Venezuela | 4.0 /100 | #242 | Tragic $44,163 |
| Sub-Saharan Africans | 3.7 /100 | #243 | Tragic $44,118 |
Demographics Similar to Immigrants from South Central Asia by Median Earnings
In terms of median earnings, the demographic groups most similar to Immigrants from South Central Asia are Immigrants from Israel ($57,034, a difference of 0.14%), Immigrants from Ireland ($56,854, a difference of 0.46%), Okinawan ($57,550, a difference of 0.76%), Immigrants from China ($56,638, a difference of 0.84%), and Immigrants from Iran ($57,612, a difference of 0.87%).
| Demographics | Rating | Rank | Median Earnings |
| Immigrants | India | 100.0 /100 | #3 | Exceptional $60,648 |
| Immigrants | Hong Kong | 100.0 /100 | #4 | Exceptional $59,433 |
| Thais | 100.0 /100 | #5 | Exceptional $59,237 |
| Immigrants | Singapore | 100.0 /100 | #6 | Exceptional $59,038 |
| Iranians | 100.0 /100 | #7 | Exceptional $58,474 |
| Immigrants | Iran | 100.0 /100 | #8 | Exceptional $57,612 |
| Okinawans | 100.0 /100 | #9 | Exceptional $57,550 |
| Immigrants | South Central Asia | 100.0 /100 | #10 | Exceptional $57,114 |
| Immigrants | Israel | 100.0 /100 | #11 | Exceptional $57,034 |
| Immigrants | Ireland | 100.0 /100 | #12 | Exceptional $56,854 |
| Immigrants | China | 100.0 /100 | #13 | Exceptional $56,638 |
| Immigrants | Australia | 100.0 /100 | #14 | Exceptional $56,305 |
| Indians (Asian) | 100.0 /100 | #15 | Exceptional $56,253 |
| Immigrants | Eastern Asia | 100.0 /100 | #16 | Exceptional $56,183 |
| Eastern Europeans | 100.0 /100 | #17 | Exceptional $55,084 |