Immigrants from Bangladesh vs Immigrants from Colombia Householder Income Ages 25 - 44 years
COMPARE
Immigrants from Bangladesh
Immigrants from Colombia
Householder Income Ages 25 - 44 years
Householder Income Ages 25 - 44 years Comparison
Immigrants from Bangladesh
Immigrants from Colombia
$90,448
HOUSEHOLDER INCOME AGES 25 - 44 YEARS
9.3/ 100
METRIC RATING
213th/ 347
METRIC RANK
$92,204
HOUSEHOLDER INCOME AGES 25 - 44 YEARS
21.3/ 100
METRIC RATING
196th/ 347
METRIC RANK
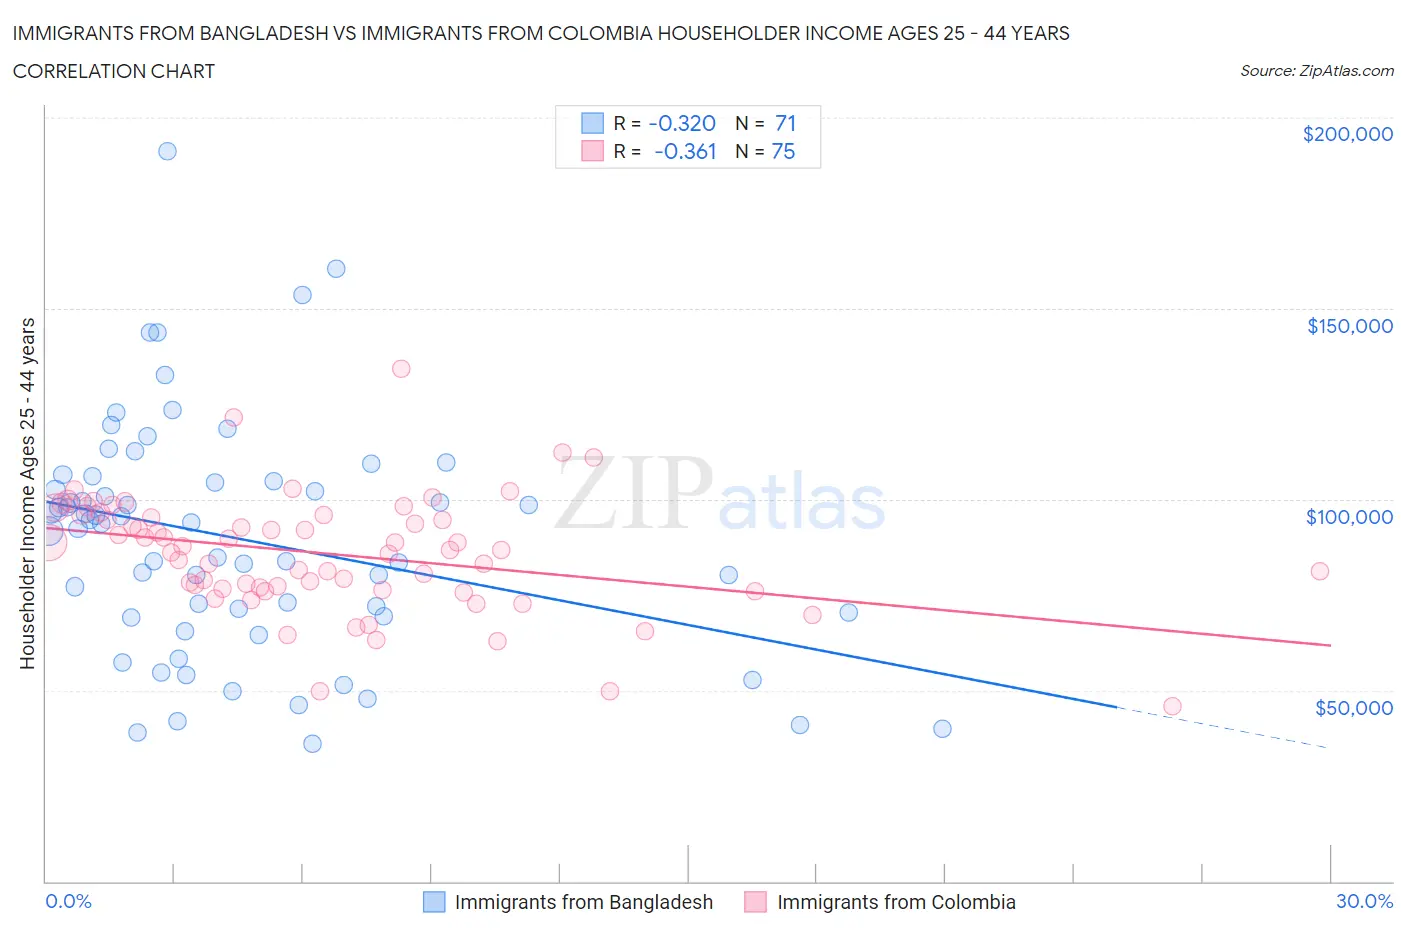
Immigrants from Bangladesh vs Immigrants from Colombia Householder Income Ages 25 - 44 years Correlation Chart
The statistical analysis conducted on geographies consisting of 203,449,247 people shows a mild negative correlation between the proportion of Immigrants from Bangladesh and household income with householder between the ages 25 and 44 in the United States with a correlation coefficient (R) of -0.320 and weighted average of $90,448. Similarly, the statistical analysis conducted on geographies consisting of 377,972,893 people shows a mild negative correlation between the proportion of Immigrants from Colombia and household income with householder between the ages 25 and 44 in the United States with a correlation coefficient (R) of -0.361 and weighted average of $92,204, a difference of 1.9%.
Householder Income Ages 25 - 44 years Correlation Summary
| Measurement | Immigrants from Bangladesh | Immigrants from Colombia |
| Minimum | $35,868 | $45,673 |
| Maximum | $191,104 | $134,128 |
| Range | $155,236 | $88,455 |
| Mean | $89,510 | $85,778 |
| Median | $93,714 | $86,881 |
| Interquartile 25% (IQ1) | $69,551 | $76,505 |
| Interquartile 75% (IQ3) | $104,853 | $95,862 |
| Interquartile Range (IQR) | $35,302 | $19,357 |
| Standard Deviation (Sample) | $30,547 | $15,210 |
| Standard Deviation (Population) | $30,331 | $15,108 |
Demographics Similar to Immigrants from Bangladesh and Immigrants from Colombia by Householder Income Ages 25 - 44 years
In terms of householder income ages 25 - 44 years, the demographic groups most similar to Immigrants from Bangladesh are Immigrants from Africa ($90,372, a difference of 0.090%), Hawaiian ($90,722, a difference of 0.30%), Immigrants from Kenya ($90,767, a difference of 0.35%), Iraqi ($90,764, a difference of 0.35%), and Immigrants from Uruguay ($91,171, a difference of 0.80%). Similarly, the demographic groups most similar to Immigrants from Colombia are Spanish ($92,200, a difference of 0.0%), Celtic ($92,241, a difference of 0.040%), Vietnamese ($92,089, a difference of 0.12%), Immigrants from the Azores ($92,322, a difference of 0.13%), and Kenyan ($91,684, a difference of 0.57%).
| Demographics | Rating | Rank | Householder Income Ages 25 - 44 years |
| Immigrants | Azores | 22.4 /100 | #194 | Fair $92,322 |
| Celtics | 21.6 /100 | #195 | Fair $92,241 |
| Immigrants | Colombia | 21.3 /100 | #196 | Fair $92,204 |
| Spanish | 21.2 /100 | #197 | Fair $92,200 |
| Vietnamese | 20.2 /100 | #198 | Fair $92,089 |
| Kenyans | 16.8 /100 | #199 | Poor $91,684 |
| Whites/Caucasians | 16.7 /100 | #200 | Poor $91,668 |
| Japanese | 16.4 /100 | #201 | Poor $91,624 |
| Ecuadorians | 16.0 /100 | #202 | Poor $91,574 |
| Immigrants | Cambodia | 15.7 /100 | #203 | Poor $91,533 |
| Nepalese | 15.4 /100 | #204 | Poor $91,498 |
| Immigrants | Eastern Africa | 15.2 /100 | #205 | Poor $91,458 |
| Aleuts | 14.5 /100 | #206 | Poor $91,370 |
| Yugoslavians | 14.5 /100 | #207 | Poor $91,368 |
| Immigrants | Thailand | 14.3 /100 | #208 | Poor $91,337 |
| Immigrants | Uruguay | 13.2 /100 | #209 | Poor $91,171 |
| Immigrants | Kenya | 10.9 /100 | #210 | Poor $90,767 |
| Iraqis | 10.8 /100 | #211 | Poor $90,764 |
| Hawaiians | 10.6 /100 | #212 | Poor $90,722 |
| Immigrants | Bangladesh | 9.3 /100 | #213 | Tragic $90,448 |
| Immigrants | Africa | 8.9 /100 | #214 | Tragic $90,372 |