Fijian vs Immigrants from Colombia Householder Income Ages 25 - 44 years
COMPARE
Fijian
Immigrants from Colombia
Householder Income Ages 25 - 44 years
Householder Income Ages 25 - 44 years Comparison
Fijians
Immigrants from Colombia
$79,956
HOUSEHOLDER INCOME AGES 25 - 44 YEARS
0.0/ 100
METRIC RATING
310th/ 347
METRIC RANK
$92,204
HOUSEHOLDER INCOME AGES 25 - 44 YEARS
21.3/ 100
METRIC RATING
196th/ 347
METRIC RANK
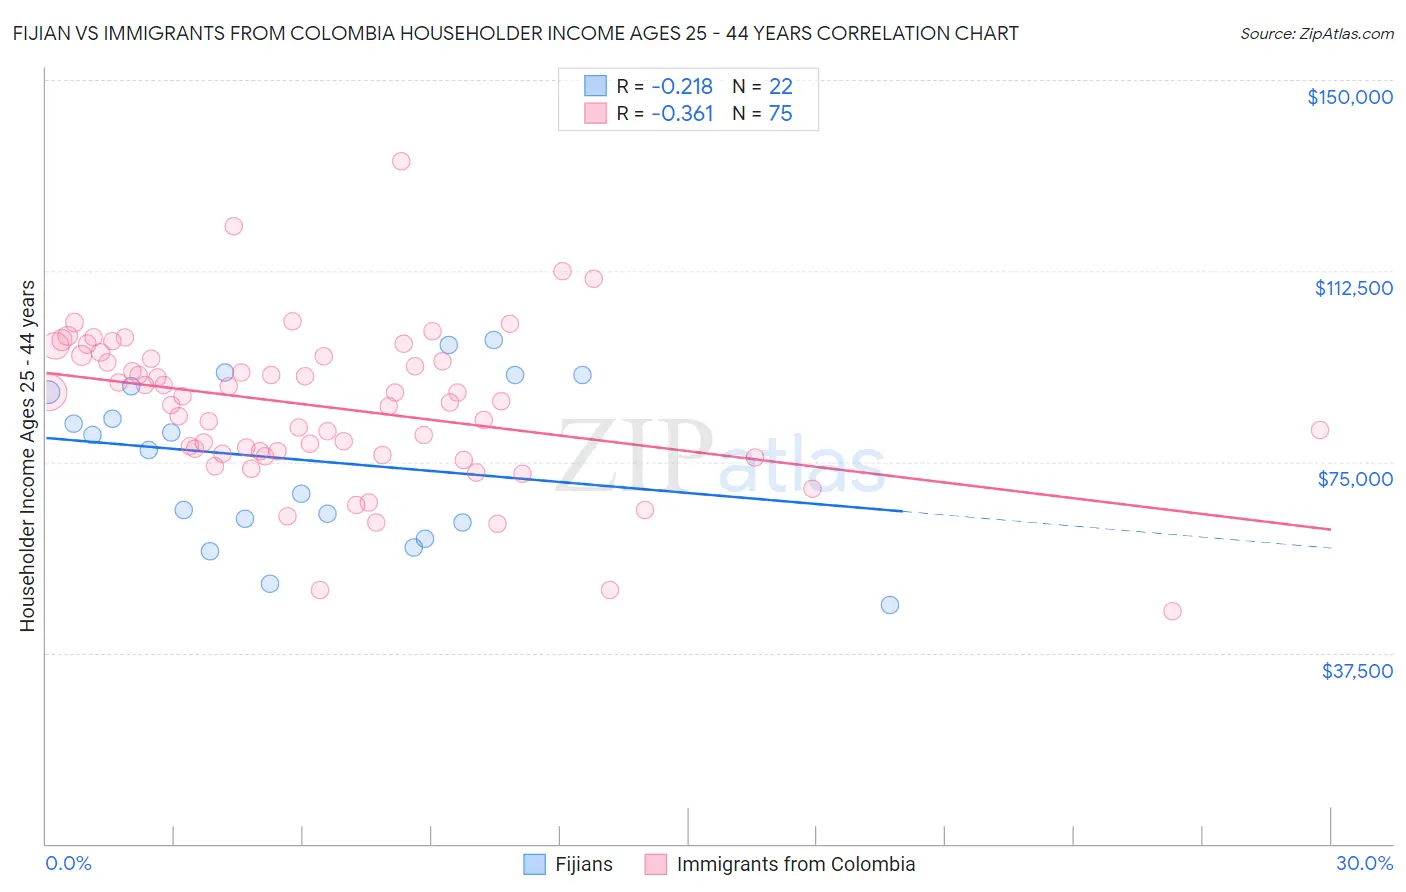
Fijian vs Immigrants from Colombia Householder Income Ages 25 - 44 years Correlation Chart
The statistical analysis conducted on geographies consisting of 55,935,087 people shows a weak negative correlation between the proportion of Fijians and household income with householder between the ages 25 and 44 in the United States with a correlation coefficient (R) of -0.218 and weighted average of $79,956. Similarly, the statistical analysis conducted on geographies consisting of 377,972,893 people shows a mild negative correlation between the proportion of Immigrants from Colombia and household income with householder between the ages 25 and 44 in the United States with a correlation coefficient (R) of -0.361 and weighted average of $92,204, a difference of 15.3%.
Householder Income Ages 25 - 44 years Correlation Summary
| Measurement | Fijian | Immigrants from Colombia |
| Minimum | $46,875 | $45,673 |
| Maximum | $98,958 | $134,128 |
| Range | $52,083 | $88,455 |
| Mean | $75,303 | $85,778 |
| Median | $78,830 | $86,881 |
| Interquartile 25% (IQ1) | $63,125 | $76,505 |
| Interquartile 75% (IQ3) | $89,954 | $95,862 |
| Interquartile Range (IQR) | $26,829 | $19,357 |
| Standard Deviation (Sample) | $15,837 | $15,210 |
| Standard Deviation (Population) | $15,473 | $15,108 |
Similar Demographics by Householder Income Ages 25 - 44 years
Demographics Similar to Fijians by Householder Income Ages 25 - 44 years
In terms of householder income ages 25 - 44 years, the demographic groups most similar to Fijians are Chippewa ($80,005, a difference of 0.060%), Immigrants from Central America ($80,012, a difference of 0.070%), Haitian ($80,055, a difference of 0.12%), Apache ($80,260, a difference of 0.38%), and Immigrants from Dominican Republic ($80,319, a difference of 0.45%).
| Demographics | Rating | Rank | Householder Income Ages 25 - 44 years |
| Mexicans | 0.0 /100 | #303 | Tragic $80,427 |
| Immigrants | Caribbean | 0.0 /100 | #304 | Tragic $80,326 |
| Immigrants | Dominican Republic | 0.0 /100 | #305 | Tragic $80,319 |
| Apache | 0.0 /100 | #306 | Tragic $80,260 |
| Haitians | 0.0 /100 | #307 | Tragic $80,055 |
| Immigrants | Central America | 0.0 /100 | #308 | Tragic $80,012 |
| Chippewa | 0.0 /100 | #309 | Tragic $80,005 |
| Fijians | 0.0 /100 | #310 | Tragic $79,956 |
| Indonesians | 0.0 /100 | #311 | Tragic $79,543 |
| Immigrants | Haiti | 0.0 /100 | #312 | Tragic $79,391 |
| Menominee | 0.0 /100 | #313 | Tragic $79,358 |
| Cheyenne | 0.0 /100 | #314 | Tragic $79,152 |
| Ottawa | 0.0 /100 | #315 | Tragic $79,012 |
| Africans | 0.0 /100 | #316 | Tragic $78,986 |
| U.S. Virgin Islanders | 0.0 /100 | #317 | Tragic $78,911 |
Demographics Similar to Immigrants from Colombia by Householder Income Ages 25 - 44 years
In terms of householder income ages 25 - 44 years, the demographic groups most similar to Immigrants from Colombia are Spanish ($92,200, a difference of 0.0%), Celtic ($92,241, a difference of 0.040%), Vietnamese ($92,089, a difference of 0.12%), Immigrants from the Azores ($92,322, a difference of 0.13%), and Samoan ($92,385, a difference of 0.20%).
| Demographics | Rating | Rank | Householder Income Ages 25 - 44 years |
| Dutch | 30.5 /100 | #189 | Fair $93,081 |
| Welsh | 30.0 /100 | #190 | Fair $93,039 |
| Tlingit-Haida | 29.4 /100 | #191 | Fair $92,987 |
| Immigrants | Costa Rica | 28.2 /100 | #192 | Fair $92,876 |
| Samoans | 23.0 /100 | #193 | Fair $92,385 |
| Immigrants | Azores | 22.4 /100 | #194 | Fair $92,322 |
| Celtics | 21.6 /100 | #195 | Fair $92,241 |
| Immigrants | Colombia | 21.3 /100 | #196 | Fair $92,204 |
| Spanish | 21.2 /100 | #197 | Fair $92,200 |
| Vietnamese | 20.2 /100 | #198 | Fair $92,089 |
| Kenyans | 16.8 /100 | #199 | Poor $91,684 |
| Whites/Caucasians | 16.7 /100 | #200 | Poor $91,668 |
| Japanese | 16.4 /100 | #201 | Poor $91,624 |
| Ecuadorians | 16.0 /100 | #202 | Poor $91,574 |
| Immigrants | Cambodia | 15.7 /100 | #203 | Poor $91,533 |