Immigrants from Afghanistan vs Immigrants from Moldova Wage/Income Gap

COMPARE

Immigrants from Afghanistan
Race
Ancestry
AfghanAfricanAlaska NativeAlaskan AthabascanAlbanianAleutAlsatianAmericanApacheArabArapahoArgentineanArmenianAssyrian/Chaldean/SyriacAustralianAustrianBahamianBangladeshiBarbadianBasqueBelgianBelizeanBermudanBhutaneseBlackfeetBolivianBrazilianBritishBritish West IndianBulgarianBurmeseCajunCambodianCanadianCape VerdeanCarpatho RusynCelticCentral AmericanCentral American IndianCherokeeCheyenneChickasawChileanChineseChippewaChoctawColombianColvilleComancheCosta RicanCreeCreekCroatianCrowCubanCypriotCzechCzechoslovakianDanishDelawareDominicanDutchDutch West IndianEastern EuropeanEcuadorianEgyptianEnglishEstonianEthiopianEuropeanFijianFilipinoFinnishFrenchFrench American IndianFrench CanadianGermanGerman RussianGhanaianGreekGuamanian/ChamorroGuatemalanGuyaneseHaitianHmongHonduranHopiHoumaHungarianIcelanderIndian (Asian)IndonesianInupiatIranianIraqiIrishIroquoisIsraeliItalianJamaicanJapaneseJordanianKenyanKiowaKoreanLaotianLatvianLebaneseLiberianLithuanianLumbeeLuxembourgerMacedonianMalaysianMalteseMarshalleseMenomineeMexicanMexican American IndianMongolianMoroccanNative HawaiianNavajoNepaleseNew ZealanderNicaraguanNigerianNorthern EuropeanNorwegianOkinawanOsageOttawaPaiutePakistaniPalestinianPanamanianParaguayanPennsylvania GermanPeruvianPimaPolishPortuguesePotawatomiPuebloPuerto RicanPuget Sound SalishRomanianRussianSalvadoranSamoanScandinavianScotch-IrishScottishSeminoleSenegaleseSerbianShoshoneSierra LeoneanSiouxSlavicSlovakSloveneSomaliSouth AfricanSouth AmericanSouth American IndianSoviet UnionSpaniardSpanishSpanish AmericanSpanish American IndianSri LankanSubsaharan AfricanSudaneseSwedishSwissSyrianTaiwaneseThaiTlingit-HaidaTohono O'OdhamTonganTrinidadian and TobagonianTsimshianTurkishU.S. Virgin IslanderUgandanUkrainianUruguayanUteVenezuelanVietnameseWelshWest IndianYakamaYaquiYugoslavianYumanYup'ikZimbabwean
Immigration
NonimmigrantsImmigrantsAfghanistanAfricaAlbaniaArgentinaArmeniaAsiaAustraliaAustriaBahamasBangladeshBarbadosBelarusBelgiumBelizeBoliviaBosnia and HerzegovinaBrazilBulgariaBurma/MyanmarCabo VerdeCambodiaCameroonCanadaCaribbeanCentral AmericaChileChinaColombiaCongoCosta RicaCroatiaCubaCzechoslovakiaDenmarkDominicaDominican RepublicEastern AfricaEastern AsiaEastern EuropeEcuadorEgyptEl SalvadorEnglandEritreaEthiopiaEuropeFijiFranceGermanyGhanaGreeceGrenadaGuatemalaGuyanaHaitiHondurasHong KongHungaryIndiaIndonesiaIranIraqIrelandIsraelItalyJamaicaJapanJordanKazakhstanKenyaKoreaKuwaitLaosLatin AmericaLatviaLebanonLiberiaLithuaniaMalaysiaMexicoMicronesiaMiddle AfricaMoroccoNepalNetherlandsNicaraguaNigeriaNorth AmericaNorth MacedoniaNorthern AfricaNorthern EuropeNorwayOceaniaPakistanPanamaPeruPhilippinesPolandPortugalRomaniaRussiaSaudi ArabiaScotlandSenegalSerbiaSierra LeoneSingaporeSomaliaSouth AfricaSouth AmericaSouth Central AsiaSouth Eastern AsiaSouthern EuropeSpainSri LankaSt. Vincent and the GrenadinesSudanSwedenSwitzerlandSyriaTaiwanThailandTrinidad and TobagoTurkeyUgandaUkraineUruguayUzbekistanVenezuelaVietnamWest IndiesWestern AfricaWestern AsiaWestern EuropeYemenZaireZimbabweAzores
Immigrants from Moldova
Race
Ancestry
AfghanAfricanAlaska NativeAlaskan AthabascanAlbanianAleutAlsatianAmericanApacheArabArapahoArgentineanArmenianAssyrian/Chaldean/SyriacAustralianAustrianBahamianBangladeshiBarbadianBasqueBelgianBelizeanBermudanBhutaneseBlackfeetBolivianBrazilianBritishBritish West IndianBulgarianBurmeseCajunCambodianCanadianCape VerdeanCarpatho RusynCelticCentral AmericanCentral American IndianCherokeeCheyenneChickasawChileanChineseChippewaChoctawColombianColvilleComancheCosta RicanCreeCreekCroatianCrowCubanCypriotCzechCzechoslovakianDanishDelawareDominicanDutchDutch West IndianEastern EuropeanEcuadorianEgyptianEnglishEstonianEthiopianEuropeanFijianFilipinoFinnishFrenchFrench American IndianFrench CanadianGermanGerman RussianGhanaianGreekGuamanian/ChamorroGuatemalanGuyaneseHaitianHmongHonduranHopiHoumaHungarianIcelanderIndian (Asian)IndonesianInupiatIranianIraqiIrishIroquoisIsraeliItalianJamaicanJapaneseJordanianKenyanKiowaKoreanLaotianLatvianLebaneseLiberianLithuanianLumbeeLuxembourgerMacedonianMalaysianMalteseMarshalleseMenomineeMexicanMexican American IndianMongolianMoroccanNative HawaiianNavajoNepaleseNew ZealanderNicaraguanNigerianNorthern EuropeanNorwegianOkinawanOsageOttawaPaiutePakistaniPalestinianPanamanianParaguayanPennsylvania GermanPeruvianPimaPolishPortuguesePotawatomiPuebloPuerto RicanPuget Sound SalishRomanianRussianSalvadoranSamoanScandinavianScotch-IrishScottishSeminoleSenegaleseSerbianShoshoneSierra LeoneanSiouxSlavicSlovakSloveneSomaliSouth AfricanSouth AmericanSouth American IndianSoviet UnionSpaniardSpanishSpanish AmericanSpanish American IndianSri LankanSubsaharan AfricanSudaneseSwedishSwissSyrianTaiwaneseThaiTlingit-HaidaTohono O'OdhamTonganTrinidadian and TobagonianTsimshianTurkishU.S. Virgin IslanderUgandanUkrainianUruguayanUteVenezuelanVietnameseWelshWest IndianYakamaYaquiYugoslavianYumanYup'ikZimbabwean
Immigration
NonimmigrantsImmigrantsAfricaAlbaniaArgentinaArmeniaAsiaAustraliaAustriaBahamasBangladeshBarbadosBelarusBelgiumBelizeBoliviaBosnia and HerzegovinaBrazilBulgariaBurma/MyanmarCabo VerdeCambodiaCameroonCanadaCaribbeanCentral AmericaChileChinaColombiaCongoCosta RicaCroatiaCubaCzechoslovakiaDenmarkDominicaDominican RepublicEastern AfricaEastern AsiaEastern EuropeEcuadorEgyptEl SalvadorEnglandEritreaEthiopiaEuropeFijiFranceGermanyGhanaGreeceGrenadaGuatemalaGuyanaHaitiHondurasHong KongHungaryIndiaIndonesiaIranIraqIrelandIsraelItalyJamaicaJapanJordanKazakhstanKenyaKoreaKuwaitLaosLatin AmericaLatviaLebanonLiberiaLithuaniaMalaysiaMexicoMicronesiaMiddle AfricaMoldovaMoroccoNepalNetherlandsNicaraguaNigeriaNorth AmericaNorth MacedoniaNorthern AfricaNorthern EuropeNorwayOceaniaPakistanPanamaPeruPhilippinesPolandPortugalRomaniaRussiaSaudi ArabiaScotlandSenegalSerbiaSierra LeoneSingaporeSomaliaSouth AfricaSouth AmericaSouth Central AsiaSouth Eastern AsiaSouthern EuropeSpainSri LankaSt. Vincent and the GrenadinesSudanSwedenSwitzerlandSyriaTaiwanThailandTrinidad and TobagoTurkeyUgandaUkraineUruguayUzbekistanVenezuelaVietnamWest IndiesWestern AfricaWestern AsiaWestern EuropeYemenZaireZimbabweAzores
Wage/Income Gap
Income
Poverty
Unemployment
Labor Participation
Family Structure
Vehicle Availability
Education Level
Disability

Wage/Income Gap Comparison

Immigrants from Afghanistan

Immigrants from Moldova

Exceptional
Fair
24.4%
WAGE/INCOME GAP
95.9/ 100
METRIC RATING
117th/ 347
METRIC RANK
26.2%
WAGE/INCOME GAP
26.6/ 100
METRIC RATING
189th/ 347
METRIC RANK

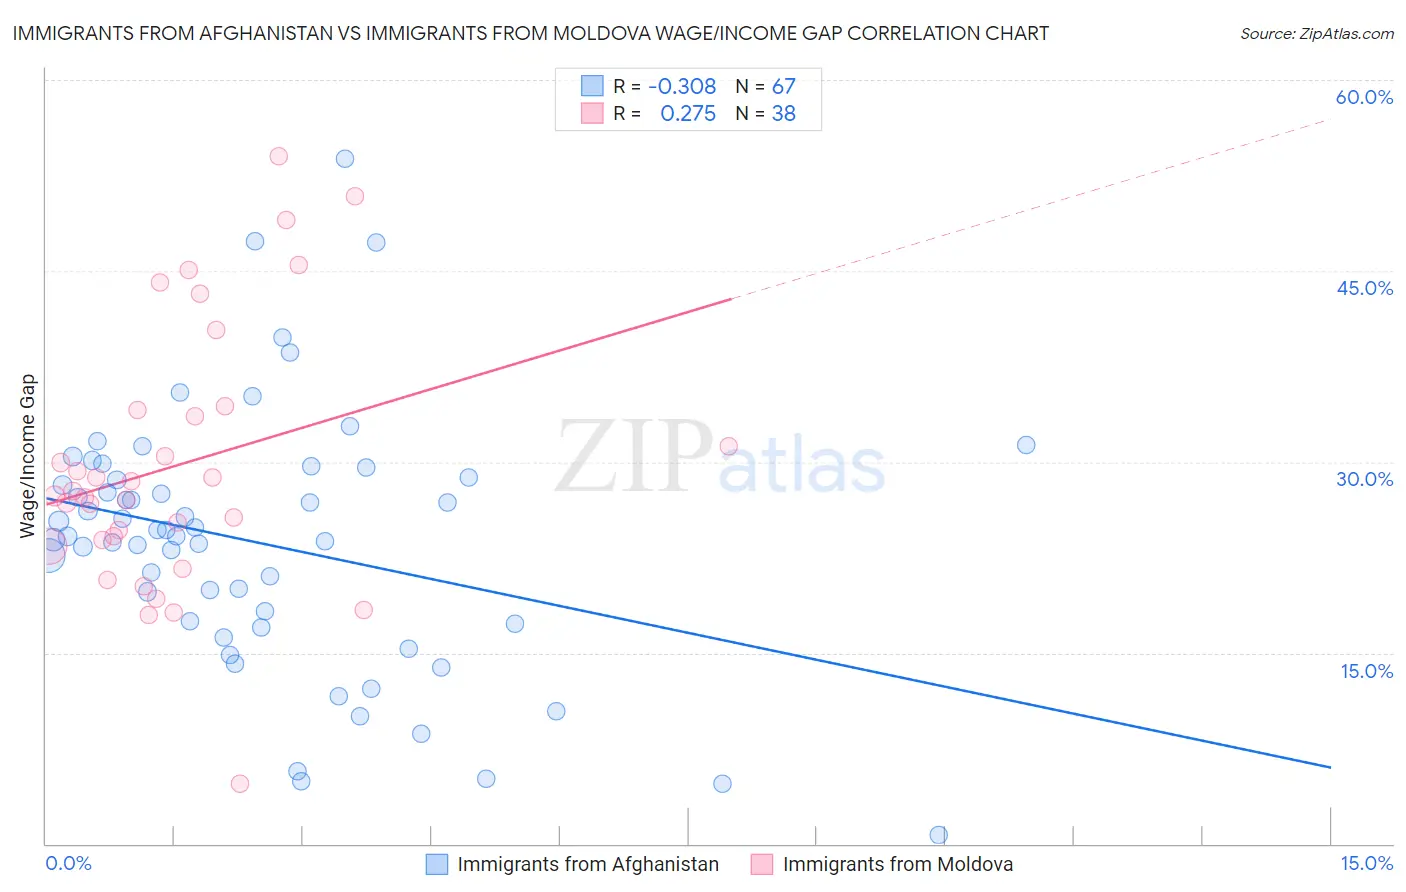
Immigrants from Afghanistan vs Immigrants from Moldova Wage/Income Gap Correlation Chart

The statistical analysis conducted on geographies consisting of 147,636,341 people shows a mild negative correlation between the proportion of Immigrants from Afghanistan and wage/income gap percentage in the United States with a correlation coefficient (R) of -0.308 and weighted average of 24.4%. Similarly, the statistical analysis conducted on geographies consisting of 124,386,174 people shows a weak positive correlation between the proportion of Immigrants from Moldova and wage/income gap percentage in the United States with a correlation coefficient (R) of 0.275 and weighted average of 26.2%, a difference of 7.2%.
Immigrants from Afghanistan vs Immigrants from Moldova Wage/Income Gap

Wage/Income Gap Correlation Summary

MeasurementImmigrants from AfghanistanImmigrants from Moldova
Minimum0.66%4.7%
Maximum53.8%54.0%
Range53.1%49.3%
Mean23.6%29.8%
Median24.1%27.5%
Interquartile 25% (IQ1)17.3%23.8%
Interquartile 75% (IQ3)28.8%34.0%
Interquartile Range (IQR)11.5%10.2%
Standard Deviation (Sample)10.1%10.4%
Standard Deviation (Population)10.1%10.3%

Similar Demographics by Wage/Income Gap

Demographics Similar to Immigrants from Afghanistan by Wage/Income Gap

In terms of wage/income gap, the demographic groups most similar to Immigrants from Afghanistan are Immigrants from Micronesia (24.4%, a difference of 0.030%), Kenyan (24.5%, a difference of 0.050%), Alaska Native (24.4%, a difference of 0.060%), Cree (24.5%, a difference of 0.13%), and Immigrants from Kenya (24.4%, a difference of 0.23%).
DemographicsRating | RankWage/Income Gap
Immigrants | Morocco
98.1
/100
|
#110
Exceptional
24.1%
Soviet Union
97.6
/100
|
#111
Exceptional
24.2%
Immigrants | Colombia
97.0
/100
|
#112
Exceptional
24.3%
Sioux
96.9
/100
|
#113
Exceptional
24.3%
Panamanians
96.5
/100
|
#114
Exceptional
24.4%
Immigrants | Kenya
96.4
/100
|
#115
Exceptional
24.4%
Alaska Natives
96.0
/100
|
#116
Exceptional
24.4%
Immigrants | Afghanistan
95.9
/100
|
#117
Exceptional
24.4%
Immigrants | Micronesia
95.8
/100
|
#118
Exceptional
24.4%
Kenyans
95.8
/100
|
#119
Exceptional
24.5%
Cree
95.6
/100
|
#120
Exceptional
24.5%
Immigrants | Thailand
94.9
/100
|
#121
Exceptional
24.5%
Apache
94.8
/100
|
#122
Exceptional
24.5%
Natives/Alaskans
94.6
/100
|
#123
Exceptional
24.6%
Immigrants | South America
93.9
/100
|
#124
Exceptional
24.6%

Demographics Similar to Immigrants from Moldova by Wage/Income Gap

In terms of wage/income gap, the demographic groups most similar to Immigrants from Moldova are Immigrants from Croatia (26.2%, a difference of 0.15%), Immigrants from Venezuela (26.2%, a difference of 0.17%), Palestinian (26.1%, a difference of 0.26%), Immigrants from Egypt (26.1%, a difference of 0.26%), and Immigrants from Bulgaria (26.3%, a difference of 0.35%).
DemographicsRating | RankWage/Income Gap
Immigrants | Serbia
35.4
/100
|
#182
Fair
26.0%
Immigrants | Kazakhstan
35.2
/100
|
#183
Fair
26.0%
Mexicans
34.4
/100
|
#184
Fair
26.0%
Pakistanis
33.7
/100
|
#185
Fair
26.1%
Immigrants | Indonesia
32.5
/100
|
#186
Fair
26.1%
Palestinians
29.9
/100
|
#187
Fair
26.1%
Immigrants | Egypt
29.9
/100
|
#188
Fair
26.1%
Immigrants | Moldova
26.6
/100
|
#189
Fair
26.2%
Immigrants | Croatia
24.8
/100
|
#190
Fair
26.2%
Immigrants | Venezuela
24.7
/100
|
#191
Fair
26.2%
Immigrants | Bulgaria
22.5
/100
|
#192
Fair
26.3%
Immigrants | Jordan
22.4
/100
|
#193
Fair
26.3%
Chileans
22.3
/100
|
#194
Fair
26.3%
Immigrants | Malaysia
22.2
/100
|
#195
Fair
26.3%
Immigrants | Western Asia
21.7
/100
|
#196
Fair
26.3%