Choctaw vs Immigrants from Moldova Wage/Income Gap
COMPARE
Choctaw
Immigrants from Moldova
Wage/Income Gap
Wage/Income Gap Comparison
Choctaw
Immigrants from Moldova
28.1%
WAGE/INCOME GAP
0.4/ 100
METRIC RATING
288th/ 347
METRIC RANK
26.2%
WAGE/INCOME GAP
26.6/ 100
METRIC RATING
189th/ 347
METRIC RANK
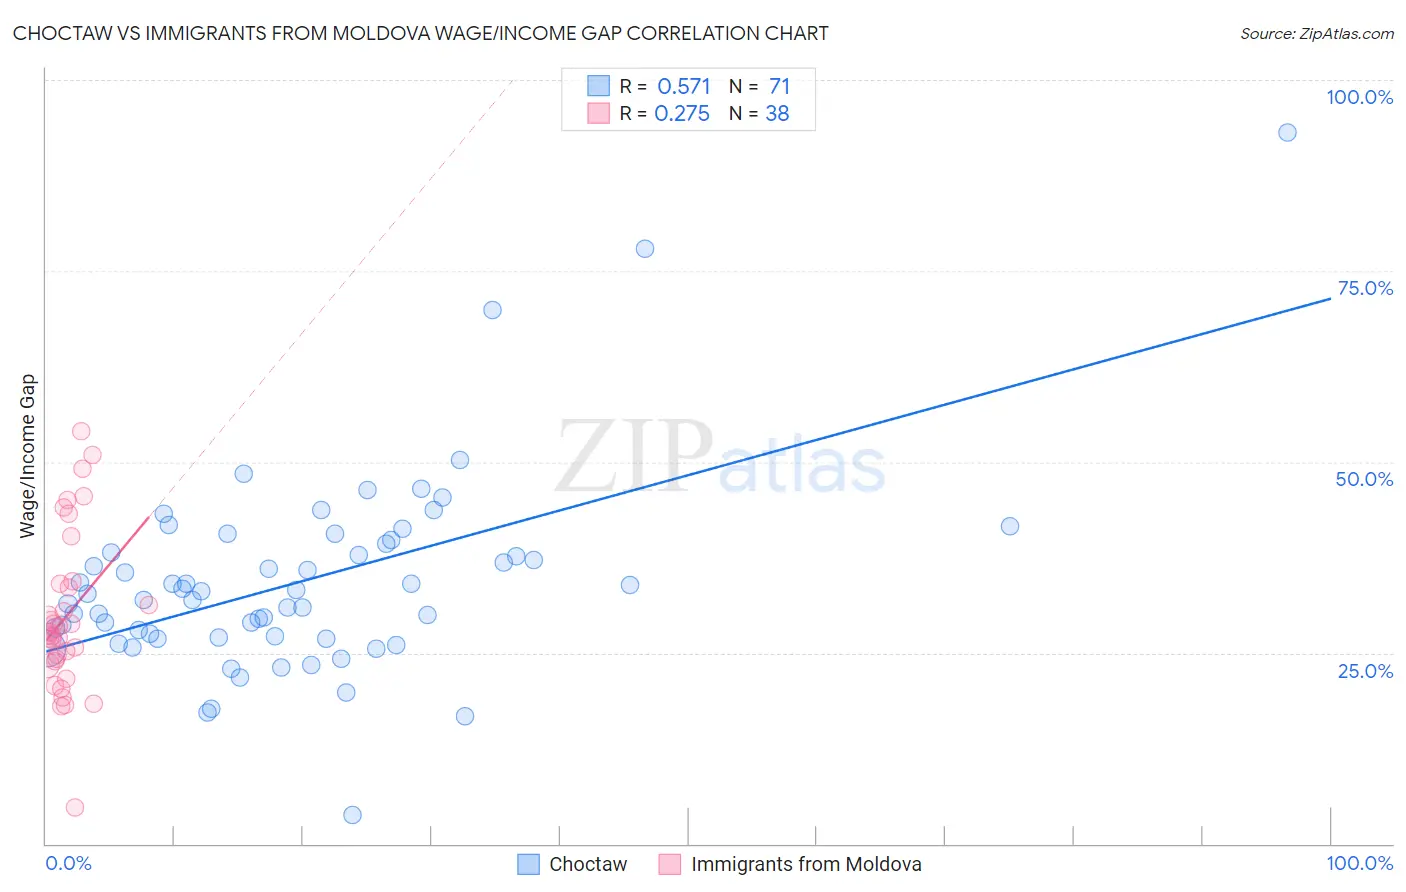
Choctaw vs Immigrants from Moldova Wage/Income Gap Correlation Chart
The statistical analysis conducted on geographies consisting of 269,462,098 people shows a substantial positive correlation between the proportion of Choctaw and wage/income gap percentage in the United States with a correlation coefficient (R) of 0.571 and weighted average of 28.1%. Similarly, the statistical analysis conducted on geographies consisting of 124,386,174 people shows a weak positive correlation between the proportion of Immigrants from Moldova and wage/income gap percentage in the United States with a correlation coefficient (R) of 0.275 and weighted average of 26.2%, a difference of 7.4%.
Wage/Income Gap Correlation Summary
| Measurement | Choctaw | Immigrants from Moldova |
| Minimum | 3.7% | 4.7% |
| Maximum | 93.1% | 54.0% |
| Range | 89.3% | 49.3% |
| Mean | 34.2% | 29.8% |
| Median | 32.7% | 27.5% |
| Interquartile 25% (IQ1) | 26.9% | 23.8% |
| Interquartile 75% (IQ3) | 39.3% | 34.0% |
| Interquartile Range (IQR) | 12.3% | 10.2% |
| Standard Deviation (Sample) | 12.9% | 10.4% |
| Standard Deviation (Population) | 12.8% | 10.3% |
Similar Demographics by Wage/Income Gap
Demographics Similar to Choctaw by Wage/Income Gap
In terms of wage/income gap, the demographic groups most similar to Choctaw are Canadian (28.1%, a difference of 0.030%), Okinawan (28.1%, a difference of 0.040%), Immigrants from Austria (28.1%, a difference of 0.070%), Italian (28.1%, a difference of 0.10%), and Australian (28.2%, a difference of 0.13%).
| Demographics | Rating | Rank | Wage/Income Gap |
| Burmese | 0.5 /100 | #281 | Tragic 28.0% |
| South Africans | 0.5 /100 | #282 | Tragic 28.0% |
| French Canadians | 0.4 /100 | #283 | Tragic 28.1% |
| Immigrants | Sweden | 0.4 /100 | #284 | Tragic 28.1% |
| Italians | 0.4 /100 | #285 | Tragic 28.1% |
| Immigrants | Austria | 0.4 /100 | #286 | Tragic 28.1% |
| Okinawans | 0.4 /100 | #287 | Tragic 28.1% |
| Choctaw | 0.4 /100 | #288 | Tragic 28.1% |
| Canadians | 0.3 /100 | #289 | Tragic 28.1% |
| Australians | 0.3 /100 | #290 | Tragic 28.2% |
| Czechoslovakians | 0.3 /100 | #291 | Tragic 28.2% |
| Immigrants | Australia | 0.3 /100 | #292 | Tragic 28.2% |
| Immigrants | Israel | 0.3 /100 | #293 | Tragic 28.2% |
| Greeks | 0.3 /100 | #294 | Tragic 28.2% |
| Slovenes | 0.3 /100 | #295 | Tragic 28.3% |
Demographics Similar to Immigrants from Moldova by Wage/Income Gap
In terms of wage/income gap, the demographic groups most similar to Immigrants from Moldova are Immigrants from Croatia (26.2%, a difference of 0.15%), Immigrants from Venezuela (26.2%, a difference of 0.17%), Palestinian (26.1%, a difference of 0.26%), Immigrants from Egypt (26.1%, a difference of 0.26%), and Immigrants from Bulgaria (26.3%, a difference of 0.35%).
| Demographics | Rating | Rank | Wage/Income Gap |
| Immigrants | Serbia | 35.4 /100 | #182 | Fair 26.0% |
| Immigrants | Kazakhstan | 35.2 /100 | #183 | Fair 26.0% |
| Mexicans | 34.4 /100 | #184 | Fair 26.0% |
| Pakistanis | 33.7 /100 | #185 | Fair 26.1% |
| Immigrants | Indonesia | 32.5 /100 | #186 | Fair 26.1% |
| Palestinians | 29.9 /100 | #187 | Fair 26.1% |
| Immigrants | Egypt | 29.9 /100 | #188 | Fair 26.1% |
| Immigrants | Moldova | 26.6 /100 | #189 | Fair 26.2% |
| Immigrants | Croatia | 24.8 /100 | #190 | Fair 26.2% |
| Immigrants | Venezuela | 24.7 /100 | #191 | Fair 26.2% |
| Immigrants | Bulgaria | 22.5 /100 | #192 | Fair 26.3% |
| Immigrants | Jordan | 22.4 /100 | #193 | Fair 26.3% |
| Chileans | 22.3 /100 | #194 | Fair 26.3% |
| Immigrants | Malaysia | 22.2 /100 | #195 | Fair 26.3% |
| Immigrants | Western Asia | 21.7 /100 | #196 | Fair 26.3% |