Hungarian vs Moroccan Median Male Earnings
COMPARE
Hungarian
Moroccan
Median Male Earnings
Median Male Earnings Comparison
Hungarians
Moroccans
$57,309
MEDIAN MALE EARNINGS
94.0/ 100
METRIC RATING
118th/ 347
METRIC RANK
$56,499
MEDIAN MALE EARNINGS
87.7/ 100
METRIC RATING
134th/ 347
METRIC RANK
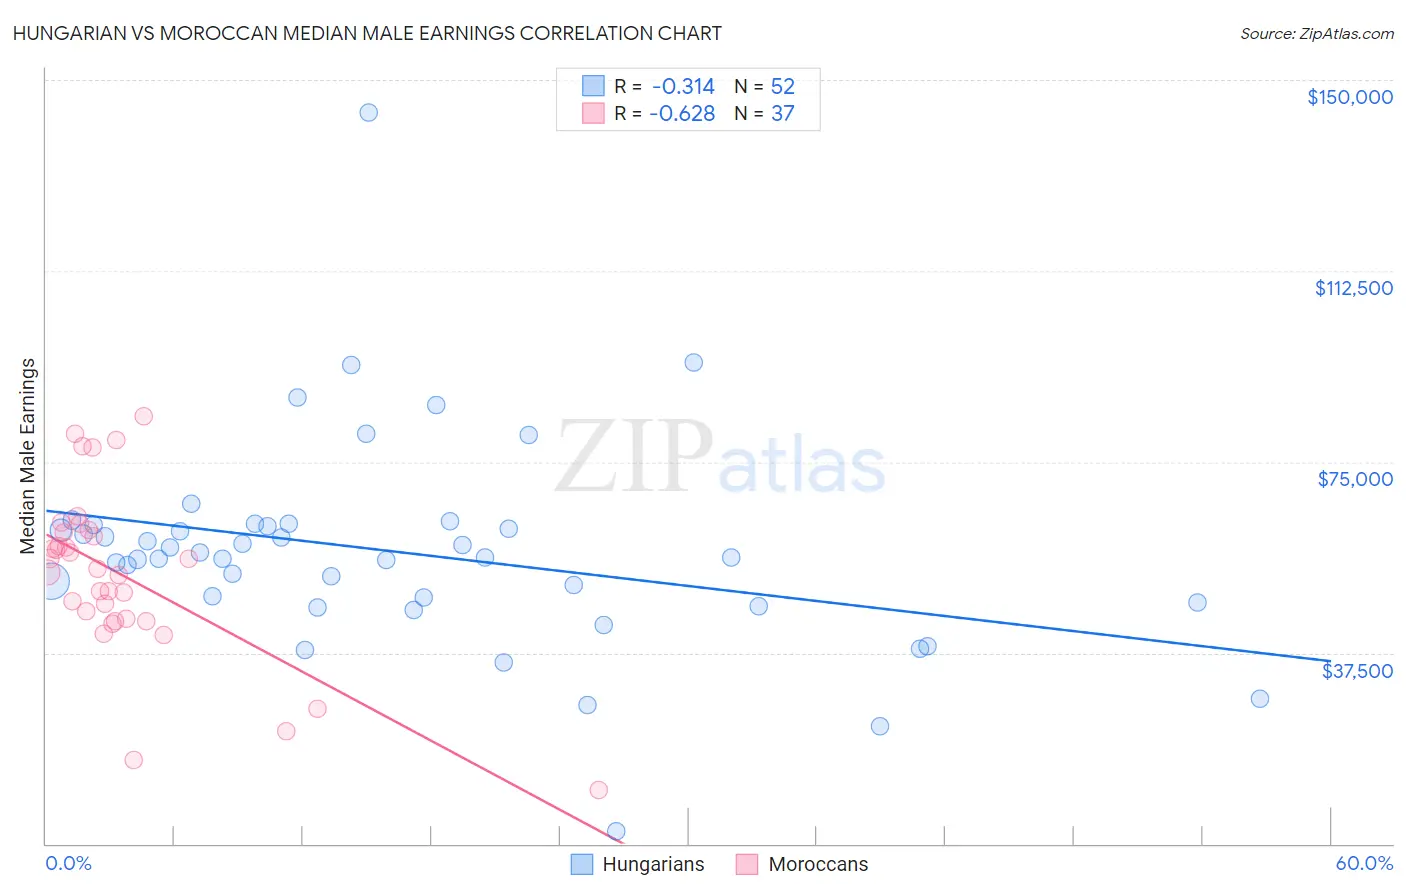
Hungarian vs Moroccan Median Male Earnings Correlation Chart
The statistical analysis conducted on geographies consisting of 485,879,965 people shows a mild negative correlation between the proportion of Hungarians and median male earnings in the United States with a correlation coefficient (R) of -0.314 and weighted average of $57,309. Similarly, the statistical analysis conducted on geographies consisting of 201,785,575 people shows a significant negative correlation between the proportion of Moroccans and median male earnings in the United States with a correlation coefficient (R) of -0.628 and weighted average of $56,499, a difference of 1.4%.
Median Male Earnings Correlation Summary
| Measurement | Hungarian | Moroccan |
| Minimum | $2,499 | $10,662 |
| Maximum | $143,630 | $84,023 |
| Range | $141,131 | $73,361 |
| Mean | $57,349 | $52,885 |
| Median | $56,238 | $54,008 |
| Interquartile 25% (IQ1) | $47,969 | $43,924 |
| Interquartile 75% (IQ3) | $62,536 | $61,434 |
| Interquartile Range (IQR) | $14,567 | $17,511 |
| Standard Deviation (Sample) | $20,677 | $16,590 |
| Standard Deviation (Population) | $20,477 | $16,364 |
Demographics Similar to Hungarians and Moroccans by Median Male Earnings
In terms of median male earnings, the demographic groups most similar to Hungarians are Arab ($57,298, a difference of 0.020%), Canadian ($57,286, a difference of 0.040%), Immigrants from Zimbabwe ($57,352, a difference of 0.080%), Lebanese ($57,409, a difference of 0.18%), and Immigrants from Albania ($57,179, a difference of 0.23%). Similarly, the demographic groups most similar to Moroccans are Irish ($56,464, a difference of 0.060%), Czech ($56,546, a difference of 0.080%), Immigrants from Germany ($56,542, a difference of 0.080%), Immigrants from Saudi Arabia ($56,452, a difference of 0.080%), and Portuguese ($56,663, a difference of 0.29%).
| Demographics | Rating | Rank | Median Male Earnings |
| Lebanese | 94.6 /100 | #116 | Exceptional $57,409 |
| Immigrants | Zimbabwe | 94.3 /100 | #117 | Exceptional $57,352 |
| Hungarians | 94.0 /100 | #118 | Exceptional $57,309 |
| Arabs | 94.0 /100 | #119 | Exceptional $57,298 |
| Canadians | 93.9 /100 | #120 | Exceptional $57,286 |
| Immigrants | Albania | 93.3 /100 | #121 | Exceptional $57,179 |
| Immigrants | Jordan | 93.1 /100 | #122 | Exceptional $57,145 |
| Slovenes | 93.1 /100 | #123 | Exceptional $57,145 |
| Chileans | 91.9 /100 | #124 | Exceptional $56,973 |
| Immigrants | Morocco | 91.8 /100 | #125 | Exceptional $56,958 |
| Chinese | 91.1 /100 | #126 | Exceptional $56,872 |
| Brazilians | 90.9 /100 | #127 | Exceptional $56,837 |
| Immigrants | Syria | 90.8 /100 | #128 | Exceptional $56,830 |
| Pakistanis | 89.9 /100 | #129 | Excellent $56,719 |
| Koreans | 89.4 /100 | #130 | Excellent $56,672 |
| Portuguese | 89.4 /100 | #131 | Excellent $56,663 |
| Czechs | 88.2 /100 | #132 | Excellent $56,546 |
| Immigrants | Germany | 88.2 /100 | #133 | Excellent $56,542 |
| Moroccans | 87.7 /100 | #134 | Excellent $56,499 |
| Irish | 87.4 /100 | #135 | Excellent $56,464 |
| Immigrants | Saudi Arabia | 87.2 /100 | #136 | Excellent $56,452 |