Hungarian vs Immigrants from Belize Median Male Earnings
COMPARE
Hungarian
Immigrants from Belize
Median Male Earnings
Median Male Earnings Comparison
Hungarians
Immigrants from Belize
$57,309
MEDIAN MALE EARNINGS
94.0/ 100
METRIC RATING
118th/ 347
METRIC RANK
$47,809
MEDIAN MALE EARNINGS
0.1/ 100
METRIC RATING
290th/ 347
METRIC RANK
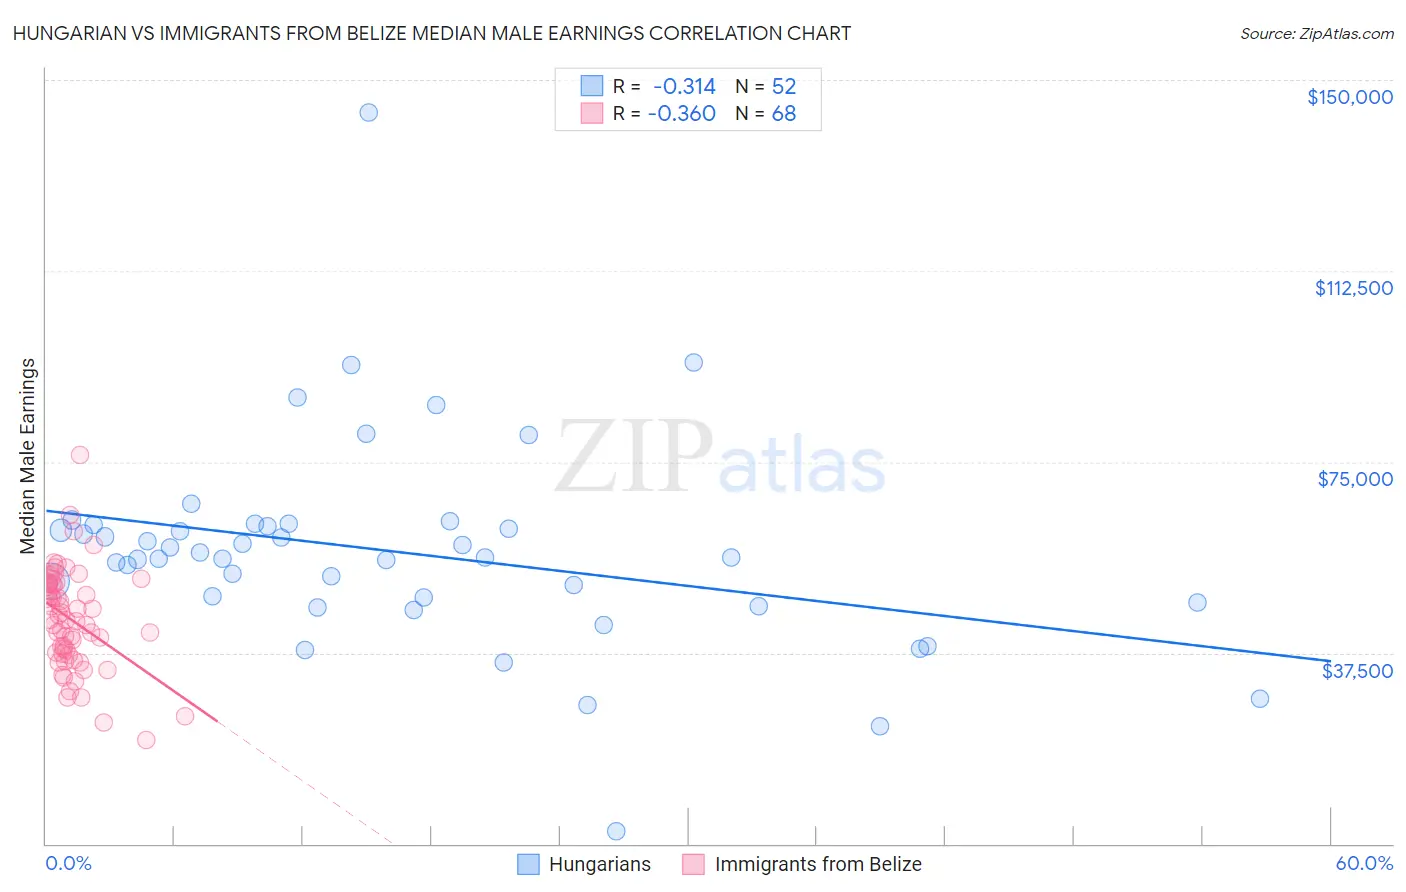
Hungarian vs Immigrants from Belize Median Male Earnings Correlation Chart
The statistical analysis conducted on geographies consisting of 485,879,965 people shows a mild negative correlation between the proportion of Hungarians and median male earnings in the United States with a correlation coefficient (R) of -0.314 and weighted average of $57,309. Similarly, the statistical analysis conducted on geographies consisting of 130,305,697 people shows a mild negative correlation between the proportion of Immigrants from Belize and median male earnings in the United States with a correlation coefficient (R) of -0.360 and weighted average of $47,809, a difference of 19.9%.
Median Male Earnings Correlation Summary
| Measurement | Hungarian | Immigrants from Belize |
| Minimum | $2,499 | $20,292 |
| Maximum | $143,630 | $76,469 |
| Range | $141,131 | $56,177 |
| Mean | $57,349 | $44,004 |
| Median | $56,238 | $43,946 |
| Interquartile 25% (IQ1) | $47,969 | $37,392 |
| Interquartile 75% (IQ3) | $62,536 | $51,048 |
| Interquartile Range (IQR) | $14,567 | $13,656 |
| Standard Deviation (Sample) | $20,677 | $9,886 |
| Standard Deviation (Population) | $20,477 | $9,813 |
Similar Demographics by Median Male Earnings
Demographics Similar to Hungarians by Median Male Earnings
In terms of median male earnings, the demographic groups most similar to Hungarians are Arab ($57,298, a difference of 0.020%), Canadian ($57,286, a difference of 0.040%), Immigrants from Zimbabwe ($57,352, a difference of 0.080%), Lebanese ($57,409, a difference of 0.18%), and Immigrants from Albania ($57,179, a difference of 0.23%).
| Demographics | Rating | Rank | Median Male Earnings |
| Europeans | 95.6 /100 | #111 | Exceptional $57,637 |
| Immigrants | Afghanistan | 95.4 /100 | #112 | Exceptional $57,582 |
| Carpatho Rusyns | 95.3 /100 | #113 | Exceptional $57,572 |
| Immigrants | Kuwait | 95.3 /100 | #114 | Exceptional $57,562 |
| Swedes | 94.8 /100 | #115 | Exceptional $57,445 |
| Lebanese | 94.6 /100 | #116 | Exceptional $57,409 |
| Immigrants | Zimbabwe | 94.3 /100 | #117 | Exceptional $57,352 |
| Hungarians | 94.0 /100 | #118 | Exceptional $57,309 |
| Arabs | 94.0 /100 | #119 | Exceptional $57,298 |
| Canadians | 93.9 /100 | #120 | Exceptional $57,286 |
| Immigrants | Albania | 93.3 /100 | #121 | Exceptional $57,179 |
| Immigrants | Jordan | 93.1 /100 | #122 | Exceptional $57,145 |
| Slovenes | 93.1 /100 | #123 | Exceptional $57,145 |
| Chileans | 91.9 /100 | #124 | Exceptional $56,973 |
| Immigrants | Morocco | 91.8 /100 | #125 | Exceptional $56,958 |
Demographics Similar to Immigrants from Belize by Median Male Earnings
In terms of median male earnings, the demographic groups most similar to Immigrants from Belize are Chickasaw ($47,832, a difference of 0.050%), Choctaw ($47,729, a difference of 0.17%), Shoshone ($47,930, a difference of 0.25%), Immigrants from Dominica ($47,651, a difference of 0.33%), and Immigrants from El Salvador ($47,973, a difference of 0.34%).
| Demographics | Rating | Rank | Median Male Earnings |
| Immigrants | Jamaica | 0.2 /100 | #283 | Tragic $48,040 |
| Africans | 0.2 /100 | #284 | Tragic $47,994 |
| Paiute | 0.2 /100 | #285 | Tragic $47,991 |
| Mexican American Indians | 0.2 /100 | #286 | Tragic $47,990 |
| Immigrants | El Salvador | 0.2 /100 | #287 | Tragic $47,973 |
| Shoshone | 0.2 /100 | #288 | Tragic $47,930 |
| Chickasaw | 0.1 /100 | #289 | Tragic $47,832 |
| Immigrants | Belize | 0.1 /100 | #290 | Tragic $47,809 |
| Choctaw | 0.1 /100 | #291 | Tragic $47,729 |
| Immigrants | Dominica | 0.1 /100 | #292 | Tragic $47,651 |
| Indonesians | 0.1 /100 | #293 | Tragic $47,503 |
| Immigrants | Nicaragua | 0.1 /100 | #294 | Tragic $47,482 |
| Central American Indians | 0.1 /100 | #295 | Tragic $47,433 |
| Inupiat | 0.1 /100 | #296 | Tragic $47,281 |
| Dominicans | 0.1 /100 | #297 | Tragic $47,204 |